整体结构分析
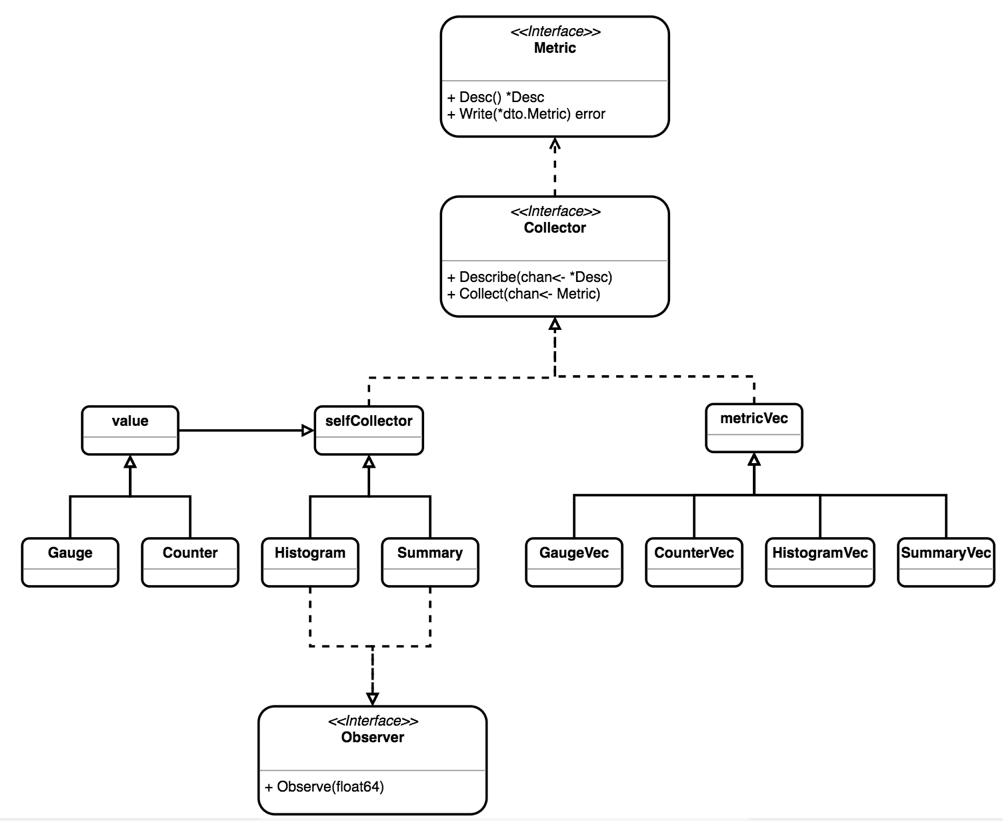
无论是 Prom 拉取 (pull) 数据,还是客户端主动推送 (push) 数据,都可以从 Collector 获取 Metric 的定义,UML 图描述了 Go 客户端中主要结构和接口之间的关系。
Collector
prometheus的Golang SDK设计得很地道, 充分利用了GO语言的特性.
在SDK中所有的指标类型都实现了prometheus.Collector 接口.
 1
 2
 3
 4
 5
 6
 7
 8
 9
10
11
12
13
14
15
16
17
18
19
20
21
22
23
24
25
26
27
28
29
30
31
32
33
34
35
36
|
// Collector is the interface implemented by anything that can be used by
// Prometheus to collect metrics. A Collector has to be registered for
// collection. See Registerer.Register.
//
// The stock metrics provided by this package (Gauge, Counter, Summary,
// Histogram, Untyped) are also Collectors (which only ever collect one metric,
// namely itself). An implementer of Collector may, however, collect multiple
// metrics in a coordinated fashion and/or create metrics on the fly. Examples
// for collectors already implemented in this library are the metric vectors
// (i.e. collection of multiple instances of the same Metric but with different
// label values) like GaugeVec or SummaryVec, and the ExpvarCollector.
type Collector interface {
	// Describe sends the super-set of all possible descriptors of metrics
	// collected by this Collector to the provided channel and returns once
	// the last descriptor has been sent. The sent descriptors fulfill the
	// consistency and uniqueness requirements described in the Desc
	// documentation. (It is valid if one and the same Collector sends
	// duplicate descriptors. Those duplicates are simply ignored. However,
	// two different Collectors must not send duplicate descriptors.) This
	// method idempotently sends the same descriptors throughout the
	// lifetime of the Collector. If a Collector encounters an error while
	// executing this method, it must send an invalid descriptor (created
	// with NewInvalidDesc) to signal the error to the registry.
	Describe(chan<- *Desc)
	// Collect is called by the Prometheus registry when collecting
	// metrics. The implementation sends each collected metric via the
	// provided channel and returns once the last metric has been sent. The
	// descriptor of each sent metric is one of those returned by
	// Describe. Returned metrics that share the same descriptor must differ
	// in their variable label values. This method may be called
	// concurrently and must therefore be implemented in a concurrency safe
	// way. Blocking occurs at the expense of total performance of rendering
	// all registered metrics. Ideally, Collector implementations support
	// concurrent readers.
	Collect(chan<- Metric)
}
|
prometheus.Collector 接口中的方法传参都是只写的chan, 使得实现接口的代码无论是同步还是并行都可以. Describe(chan<- *Desc)方法是在将Collector注册或注销时调用的, Collect(chan<- Metric)方法是在被抓取收集指标时调用的.
Collector 中 Describe 和 Collect 方法都是无状态的函数,其中 Describe 暴露全部可能的 Metric 描述列表,在注册(Register)或注销(Unregister)Collector 时会调用 Describe 来获取完整的 Metric 列表,用以检测 Metric 定义的冲突.
另外在 github.com/prometheus/client_golang/prometheus/promhttp 下的 Instrument Handler 中,也会通过 Describe 获取 Metric 列表,并检查 label 列表(InstrumentHandler 中只支持 code 和 method 两种自定义 label);而通过 Collect 可以获取采样数据,然后通过 HTTP 接口暴露给 Prom Server。另外,一些临时性的进程,如批处理任务,可以把数据 push 到 Push Gateway,由 Push Gateway 暴露 pull 接口,此处不赘述。
四种指标
客户端对数据的收集大多是针对标准数据结构来进行的:
- Counter:收集事件次数等单调递增的数据
- Gauge:收集当前的状态,比如数据库连接数
- Histogram:收集随机正态分布数据,比如响应延迟
- Summary:收集随机正态分布数据,和 Histogram 是类似的
每种标准数据结构还对应了 Vec 结构,通过 Vec 可以简洁的定义一组相同性质的 Metric,在采集数据的时候传入一组自定义的 Label/Value 获取具体的 Metric(Counter/Gauge/Histogram/Summary),最终都会落实到基本的数据结构上,这里不再赘述。
Counter 和 Gauge
Counter是计数器, 单调递增的, 只有服务重启时才会清零, 比如http请求数, errorLevel的log数. 值得一提的是, prometheus的内置函数求值时会自动处理重启清零的情况.
Guage是一个可增可减的数值指标, 比如CPU使用率, 内存使用率, 协程数.
Gauge 和 Counter 基本实现上看是一个进程内共享的浮点数,基于 value 结构实现,而 Counter 和 Gauge 仅仅封装了对这个共享浮点数的各种操作和合法性检查逻辑。
先看 Counter 中 Inc 函数的实现,图为 value 结构中 Inc 函数的实现。
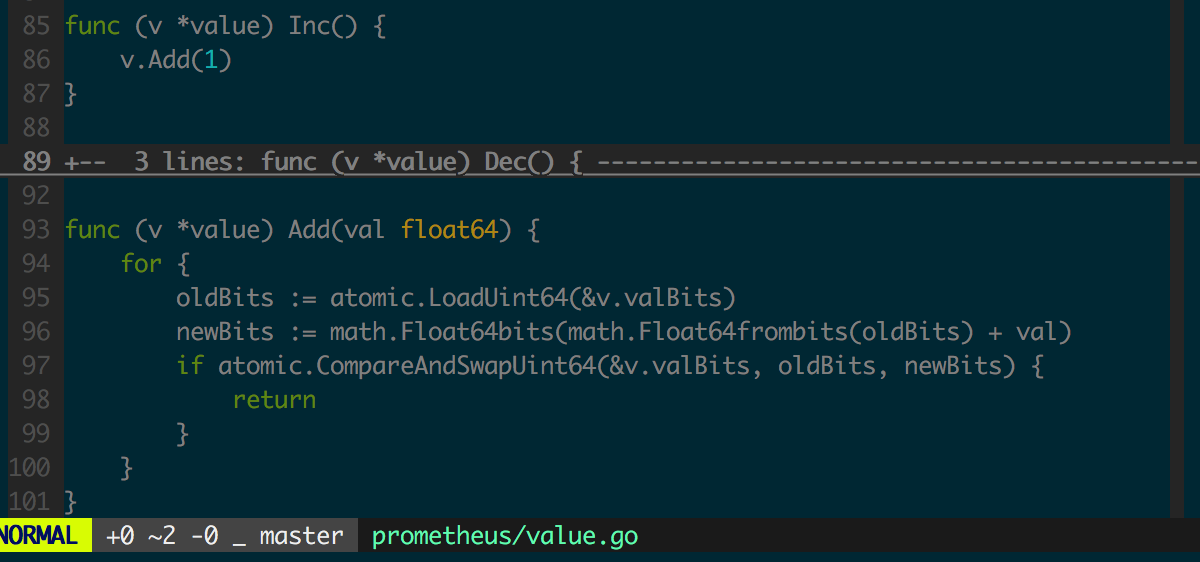
counter的value是float64, 怎么无锁地操作float64呢? 答案是用math包将其视作uint64来操作.
value.Add 中修改共享数据时采用了“无锁”实现,相比“有锁 (Mutex)”实现可以更充分利用多核处理器的并行计算能力,性能相比加 Mutex 的实现会有很大提升。图中是 Go Benchmark 的测试结果,对比了“有锁”(用 defer 或不用 defer 来释放锁)和“无锁”实现在多核场景下对性能的影响。
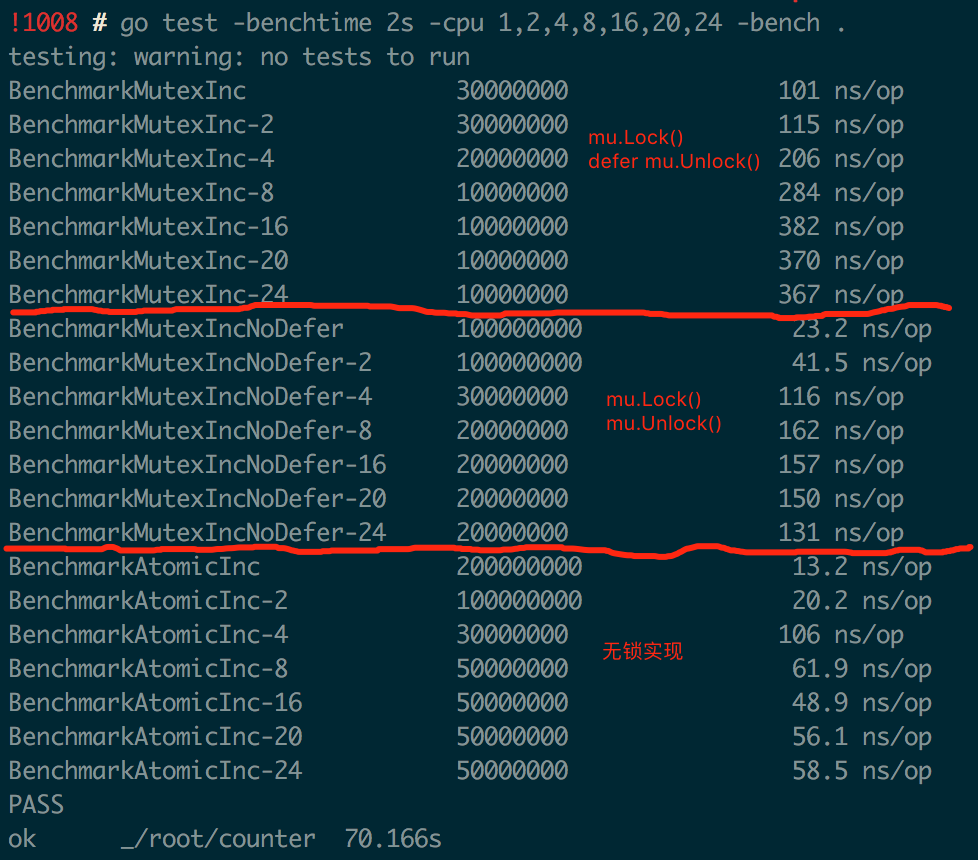
注意图中针对“有锁”的实现,进行了两组实验,其中一组用 defer 来释放锁,可见在多核场景下“无锁”实现的性能最好也最稳定。
counter的Add方法不能传负数, 否则会panic.
Counter 和 Gauge 中的其他操作都很简单,不赘述。
Histogram
Historygram是直方图, 适合需要知道数值分布范围的场景, 比如http请求的响应时长, http请求的响应包体大小等.
直方图的组距不一定是固定的, 可以自己定义适合, 这里称其为bucket, 每一个metric value根据其数值大小落在对应的bucket.
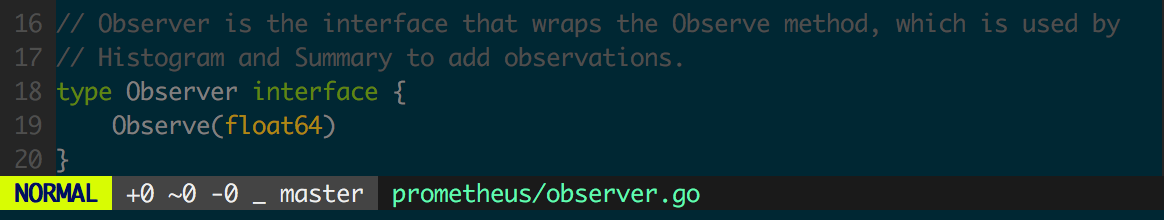
Histogram 实现了 Observer 接口,用来获取客户端状态初始化(重启)到某个时间点的采样点分布,监控数据常需要服从正态分布。
先看通过 Histogram 采集一个 float64 数据的 Observe 方法实现(图 1.3.2)。
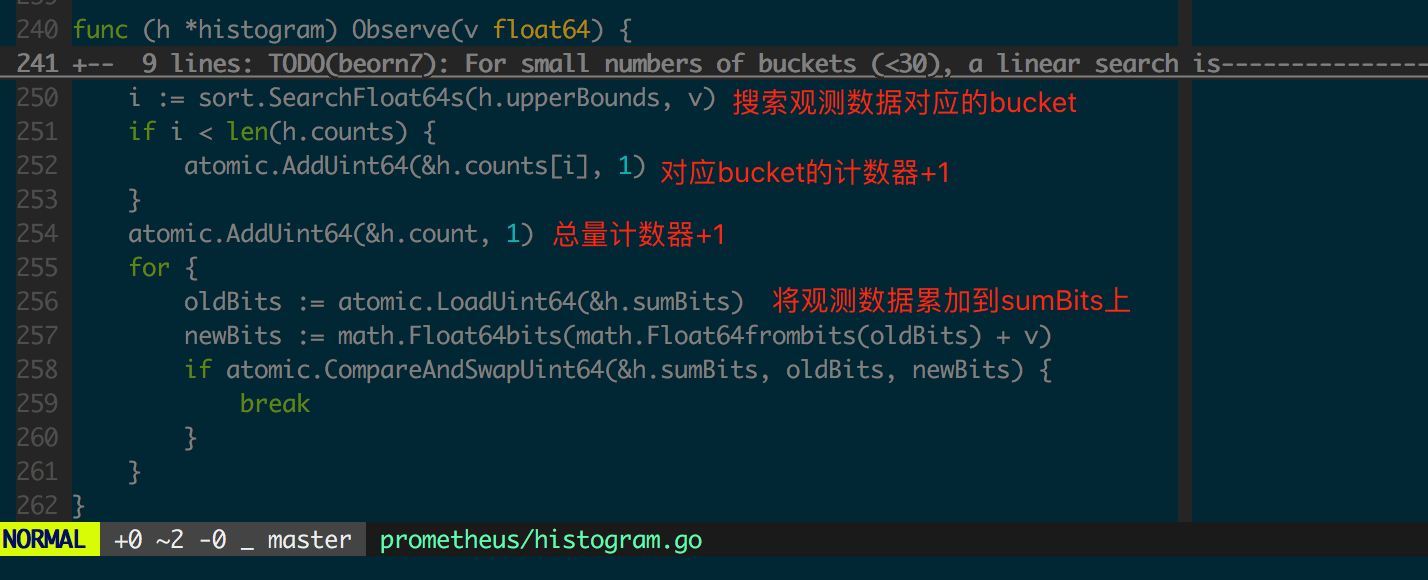
此处每个 bucket 对应的 count 是不互相包含的,bucket 的计数器之和应该等于全局计数器,即 h.count == sum(h.counts) 是成立的。然而为了便于服务端存储和计算,最终服务端收集到的数据是向下包含的,这是在 histogram.Write(图 1.3.3)中实现的。
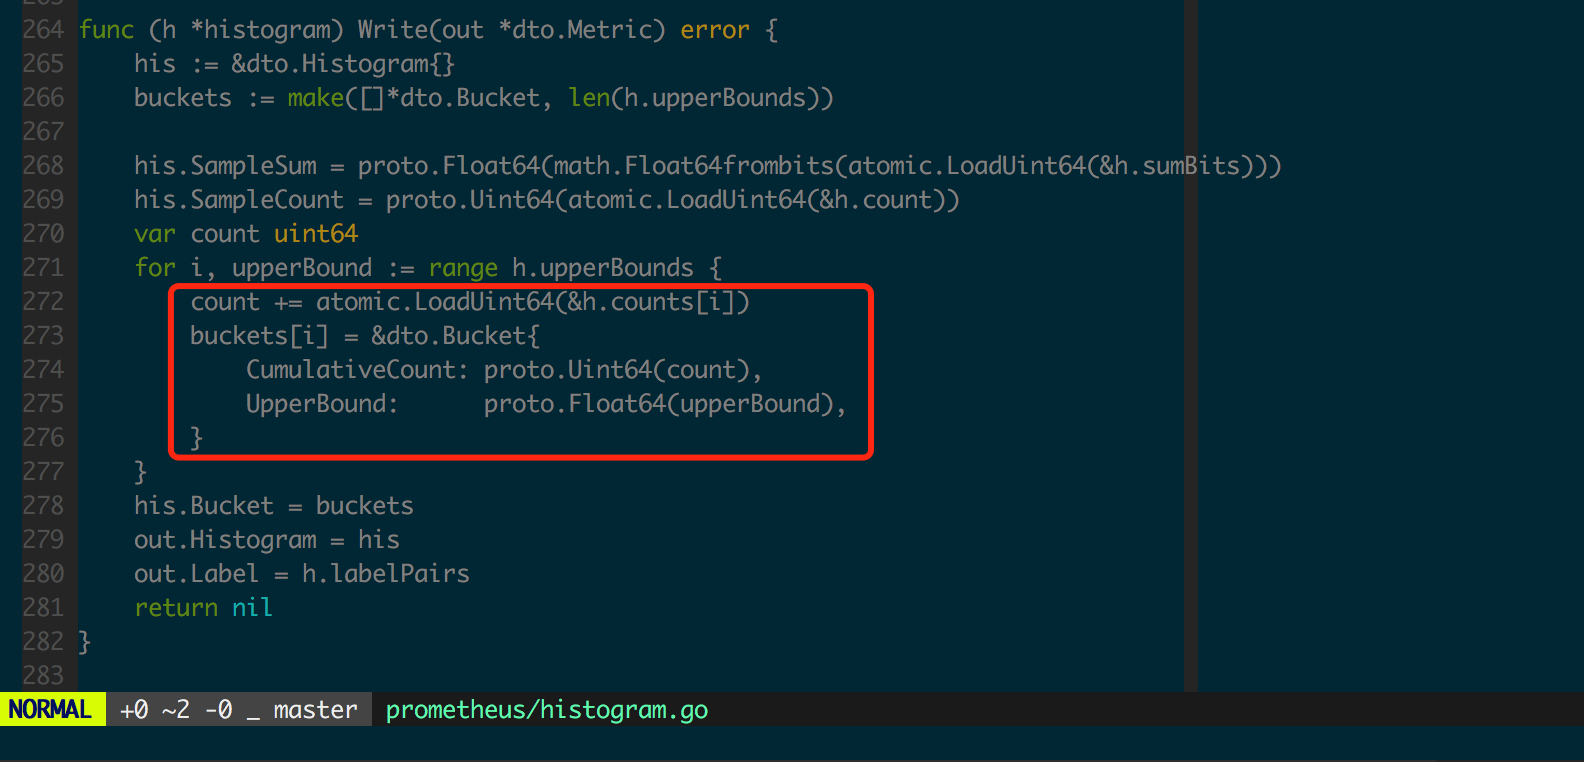
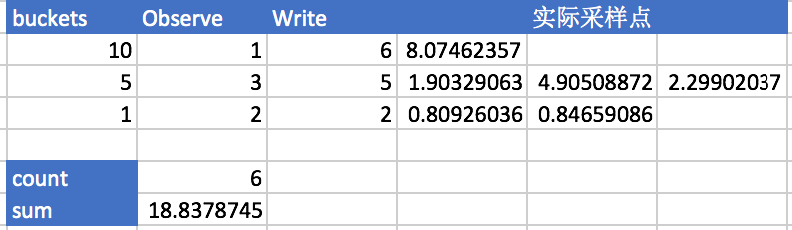
图 1.3.4 中用表格形式给出了 Histogram 采集和整理数据的过程。
Histogram 在客户端也是无锁的,因为每个采样点只更新一个具体 bucket 内的 Counter(float64),因此客户端性能开销相比 Counter 和 Gauge 而言没有明显改变,适合高并发的数据收集。
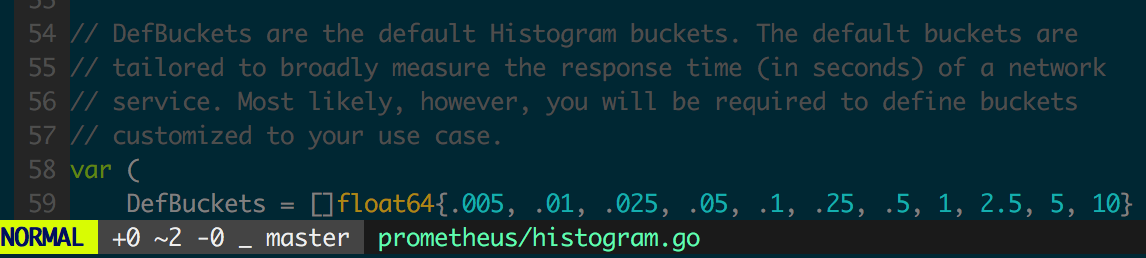
图 1.3.5 为 Go 客户端的 Histogram 默认 bucket 设置,可以用来采集 Web 服务响应时间,实际应用中通常需要为监控对象选择合理的 buckets,buckets 应设置为正态分布中常用的分位点。
Summary
Summary相比Historygram是按百分位聚合好的直方图, 适合需要知道百分比分布范围的场景, 比如对于 http请求的响应时长, Historygram是侧重在于统计小于1ms的请求有多少个, 1ms~10ms的请求有多少个, 10ms以上的请求有多少个, 而Summary在于统计20%的请求的响应时间是多少, 50%的请求的响应时间是多少, 99%的请求的响应时间是多少. Historygram是计数原始数据, 开销小, 执行查询时有对应的函数计算得到p50, p99, 而Summary是在客户端SDK测做了聚合计算得到指定的百分位, 开销更大一些.
Summary 是标准数据结构中最复杂的一个,用来收集服从正态分布的采样数据。在 Go 客户端 Summary 结构和 Histogram 一样,都实现了 Observer 接口(图 1.3.1)。
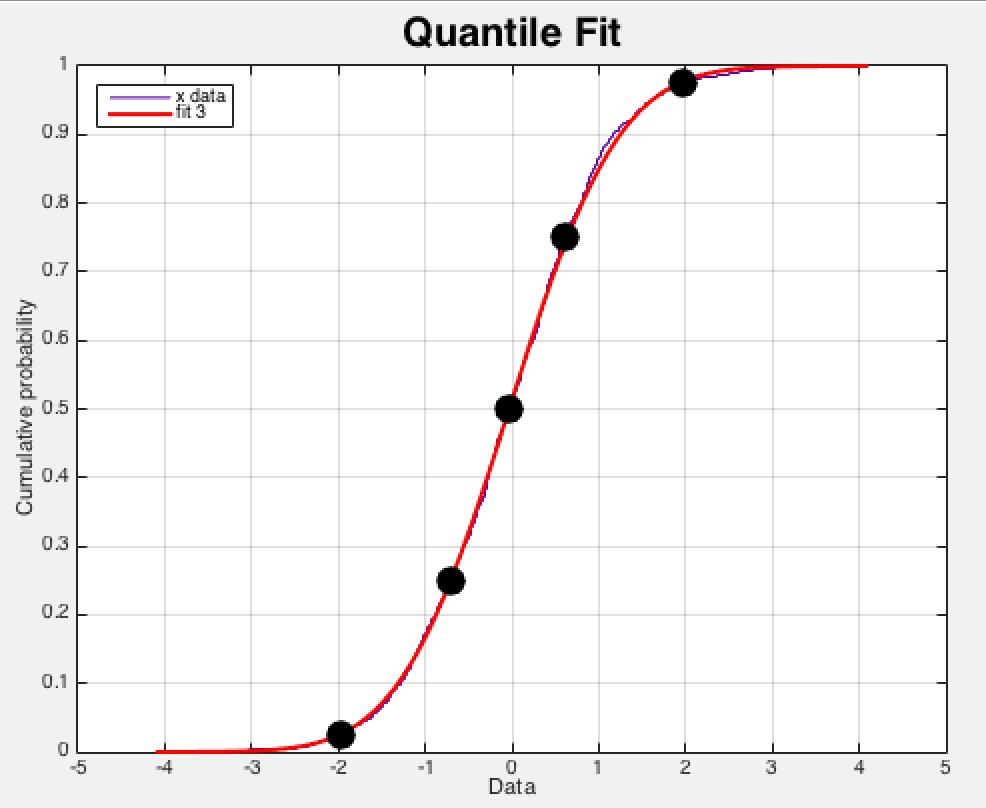
Summary 中 quantile 实际上是正态分布中的分位点 ,如图 1.4.1 所示,图中的实心圆点分别代表 [0.025 0.25 0.50 0.75 0.975] 分位点,图 2.1.10 中 0.5 分位点的采样数据为 0,而 0.975 分位点的采样值为 2,这说明采样数据的绝大部分的峰值都在 2 附近。
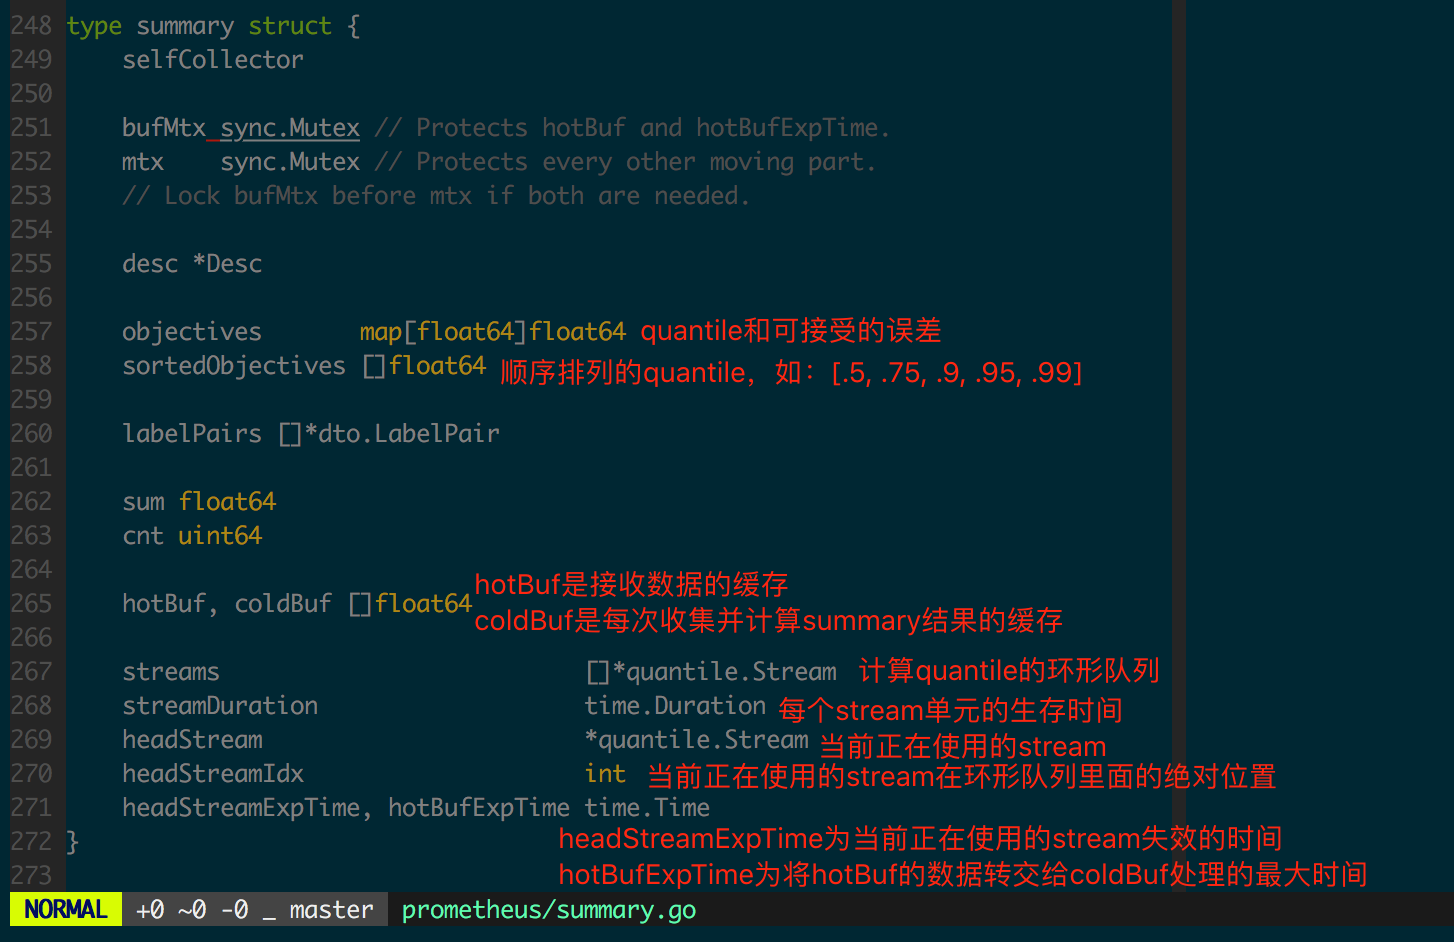
由于 Summary 结构的客户端实现相比其他几个结构而言复杂一些,先看一下 summary 结构的定义(图 1.4.2)。
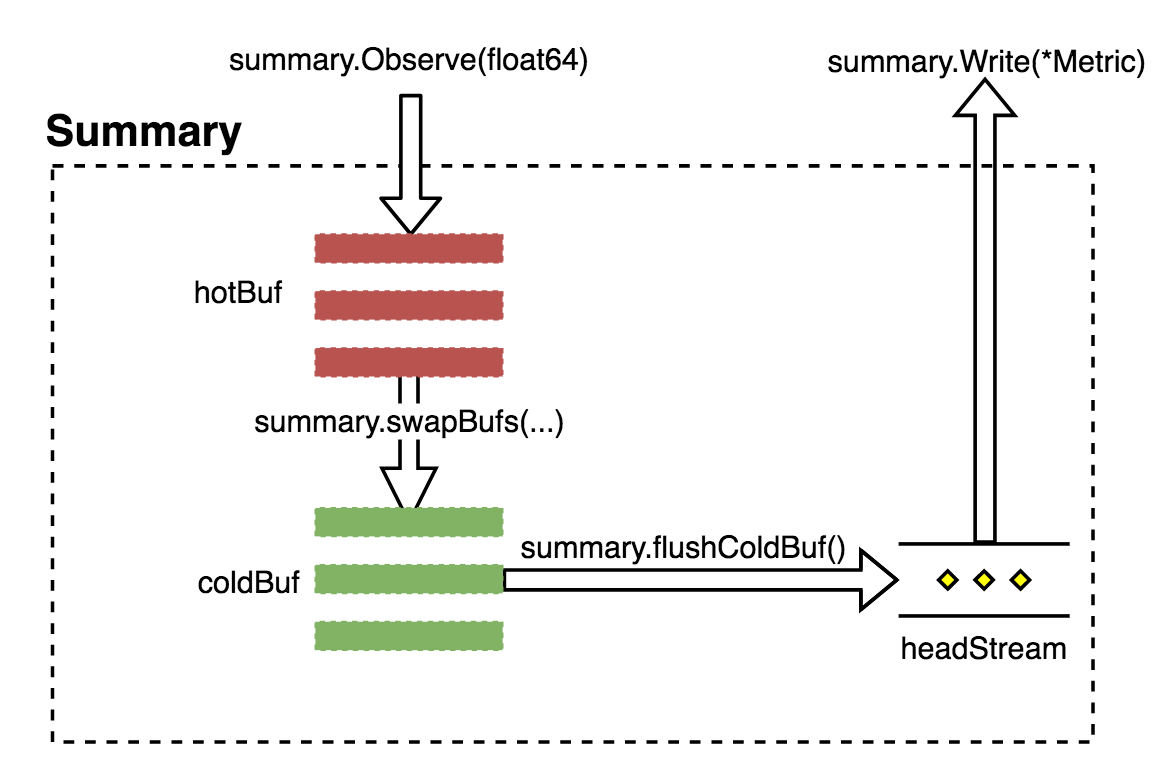
Summary 会将采集到的数据经过正态分布逼近得出对应分位点的采样数据,数据流如图 1.4.3 所示。
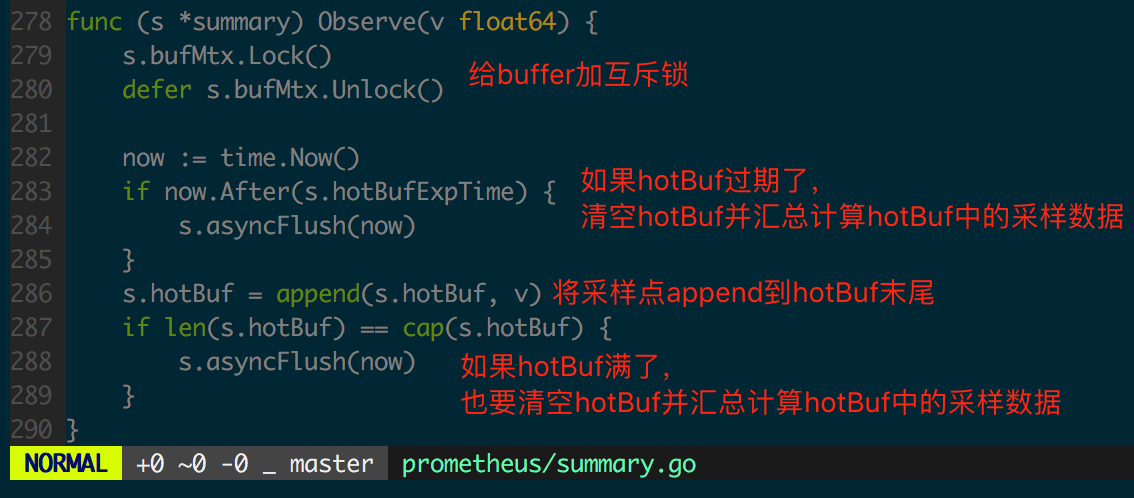
接下来看 summary.Observe 实现,图 1.4.4 和 1.4.5 中加入了代码逻辑的注解。
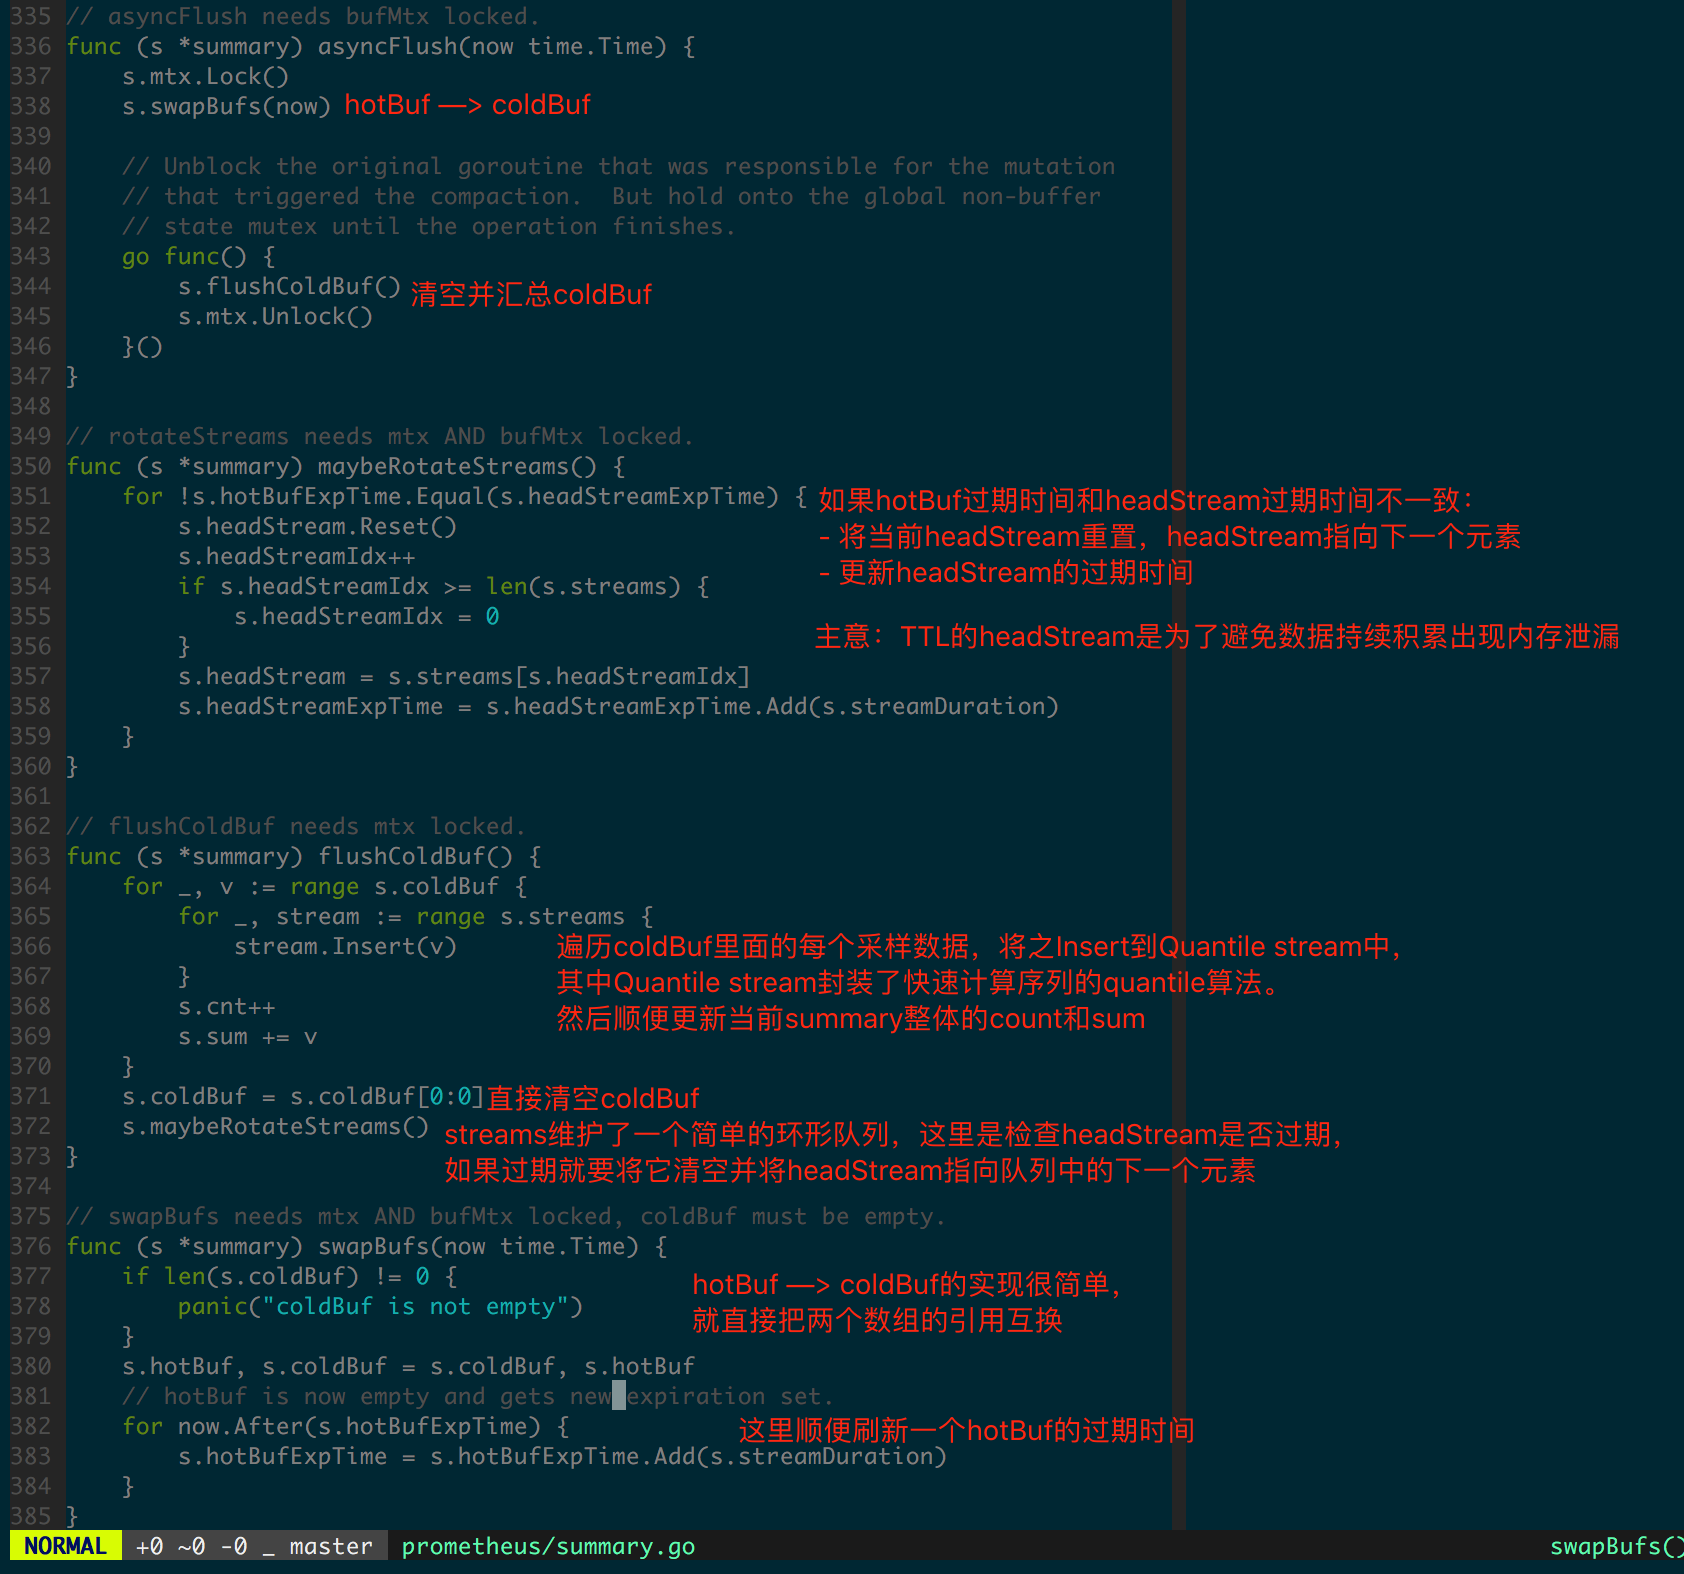
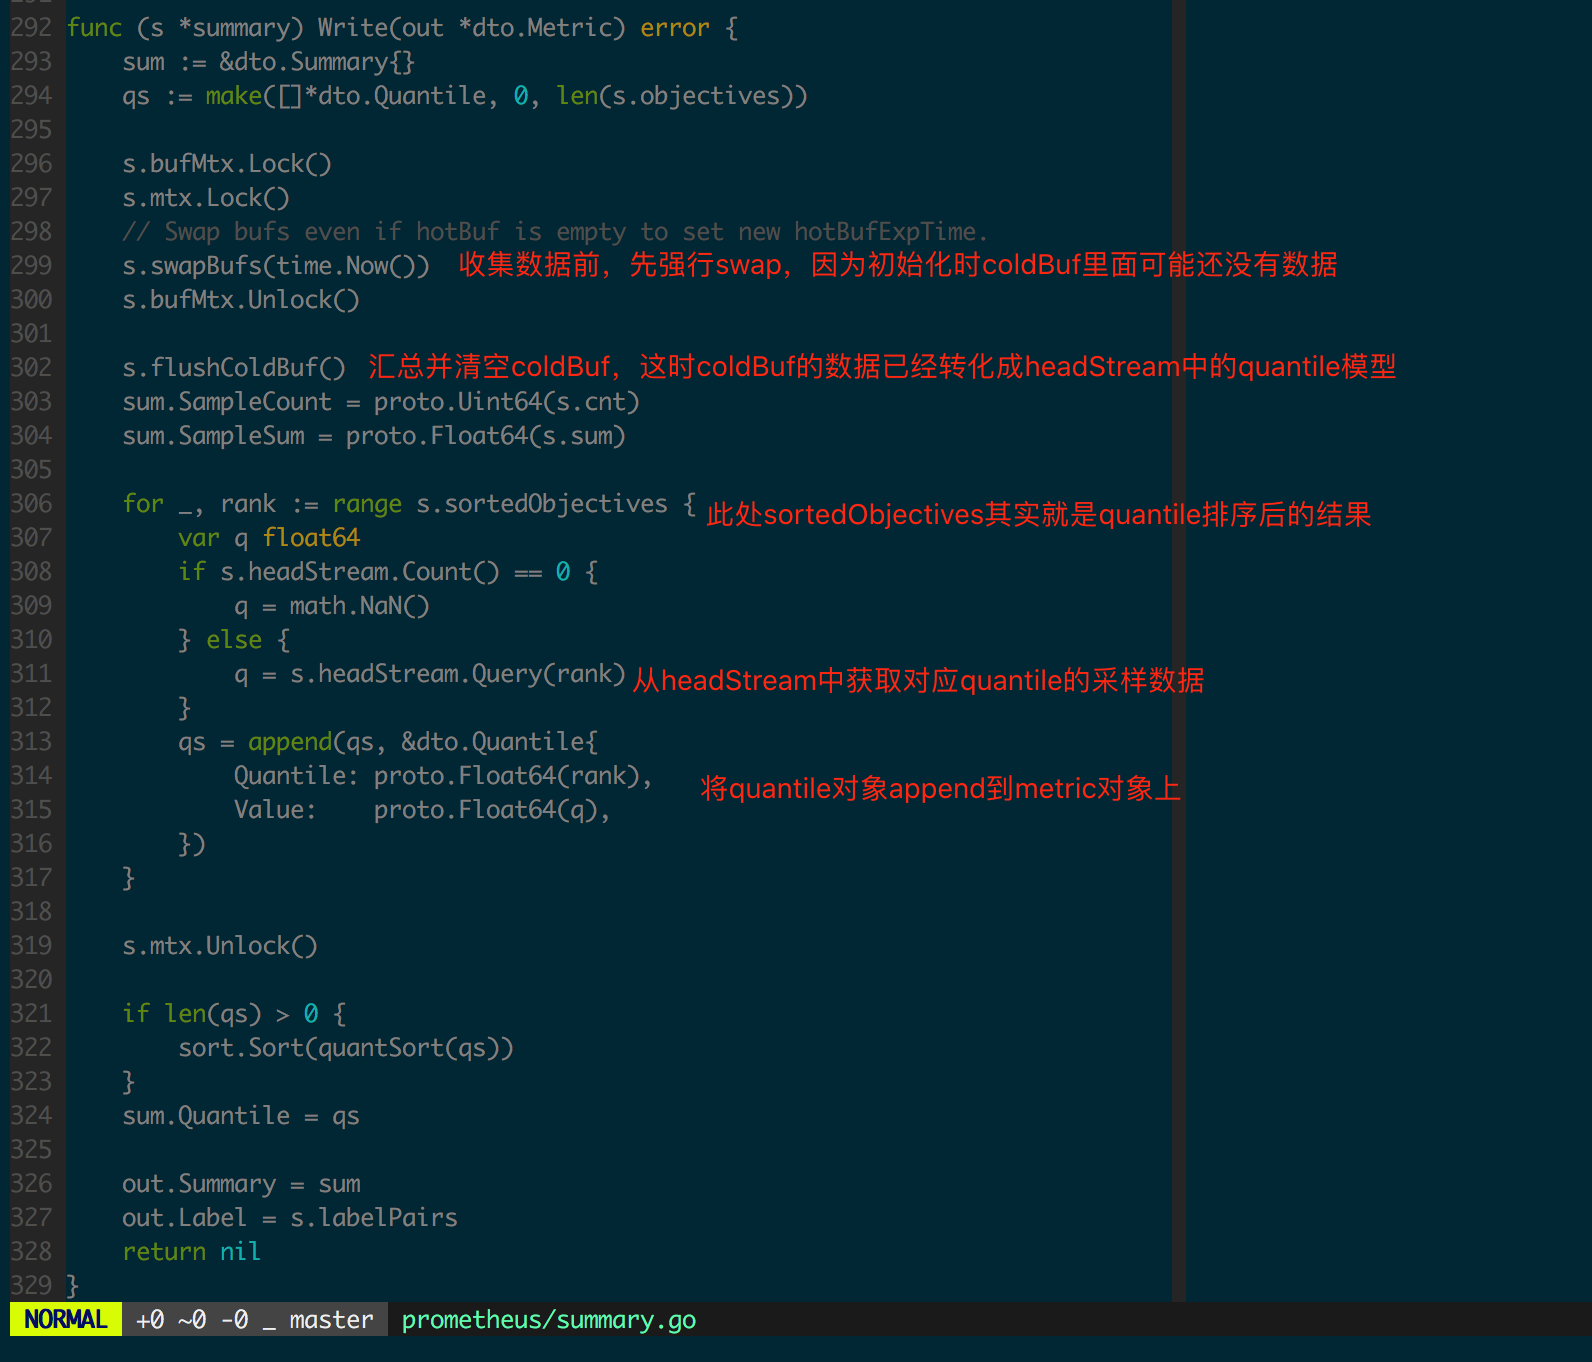
再看 summary.Write 实现,图 1.4.6 中加入了代码逻辑的注解。
Vec
带label的指标类型使用prometheus.NewCounterVec prometheus.NewGaugeVec prometheus.NewHistogramVec prometheus.NewSummaryVec, 不同的label值就像空间直角坐标系中的以原点为七点的不同方向的向量一样.
调用Vec类型的WithLabelValues方法传入的value参数数量一定要和注册时定义的label数量一致, 否则会panic.
以下是client go提供的对数组全部操作的接口。
 1
 2
 3
 4
 5
 6
 7
 8
 9
10
11
12
13
14
15
16
17
18
19
20
21
22
23
24
25
26
27
28
29
30
31
32
33
34
35
36
37
38
39
40
41
42
43
44
45
46
47
48
49
50
51
52
53
54
55
56
57
58
59
60
61
62
63
64
|
//metricVec实现了具体结构和接口,提供给四种数组类型调用,部分接口不提供给用户
//位于github.com/prometheus/client_golang/prometheus/vec.go
type metricVec struct {
    *metricMap
    curry []curriedLabelValue

    hashAdd     func(h uint64, s string) uint64
    hashAddByte func(h uint64, b byte) uint64
}

//删除匹配的labels,删除成功返回true,如果未找到则返回false,并不是error
//两者的不同:
//  Delete用法: vec.Delete(Labels{"l1": "v1", "l2": "v2"})
//  DeleteLabelValues用法: vec.DeleteLabelValues("v1", "v2")
//如果后者参数的顺序有问题,则返回false,而前者不会
//但是与之带来的是前者的开销要比后者大,因为前者要构建Labels映射
func (m *metricVec) DeleteLabelValues(lvs ...string) bool{}
func (m *metricVec) Delete(labels Labels) bool {}


type Observer interface {
    Observe(float64)
}

//XXX需要使用Counter,Gauge,Histogram,Summary来代替
//以下接口实现于counter.go, gauge.go, histogram.go, summary.go
type XXXVec struct {
    *metricVec
}

//将返回数组实例,如 NewCounterVec,将返回一个 *CounterVec,
//注意,调用时,opts 中, Histogtam的Budket不能有"le", Summary的quantile不能有"quantile",否则painc()
func NewXXXVec(opts XXXOpts, labelNames []string) *XXXVec{}

//如果CounterVec则 TTT为Counter,GaugeVec则TTT为Gauge,Histogram和Summary则TTT为Observer

//获取Counter,Gauge,Histogram或Summary,如果存在则返回,不存在则创建,如果name相同,描述不同,则返回error。
//用法:
//  vec.GetMetricWith(Labels{"l1": "v1", "l2": "v2"})
//  vec.GetMetricWithLabelValues("v1", "v2")
//很容易因为顺序问题而导致错误或获取不到,所以建议使用前者,但与之带来的是前者会有额外消耗
//如果我们只想获取,如果获取不到不创建新的的话,那么是做不到的,不过我们不保存返回的实例就好了。如果考虑到消耗,也可以使用Delete来移除它
func (v *XXXVec) GetMetricWith(labels Labels) (TTT, error){}
func (v *XXXVec) GetMetricWithLabelValues(lvs ...string)(TTT, error){}

//分别为GetMetricWith和GetMetricWithLabelValues的must形式
//即如果出错则panic(),不会返回error
//不建议使用must形式,因为觉得我们自己处理error的能力还是要有的,即使我们捕捉到error之后和它做相同的事
func (v *XXXVec) WithLabelValues(lvs ...string) TTT{}
func (v *XXXVec) With(labels Labels) TTT{}

//CurryWith将根据传入的labels,进行匹配,返回xxxVec形式,xxxVec并不是数组类型!
//作用为了返回子xxxVec
//注意,不要对返回值进行for range,因为不是数组,并且里面的值和方法并不是公开的。
//可能的使用情况:
//  TestHistogramVec := NewHistogramVec(HistogramVecOpts{
//      Name : "test_name",
//      Help : "test_help",
//      Buckets: prometheus.LinearBuckets(20, 5, 5),
//  },[]string{"color","size","weight"})
//  TestHistogramVecSon := CurryWith("color":"black")
func (v *XXXVec) CurryWith(labels Labels) (TTTVec, error){}
//CurryWith的Must形式,出现异常直接panic()
func (v *XXXVec) MustCurryWith(labels Labels) TTTVec{}
|
数组的使用:
 1
 2
 3
 4
 5
 6
 7
 8
 9
10
11
12
13
14
15
16
17
18
19
20
21
22
23
24
25
26
27
28
29
30
31
32
33
34
35
36
37
38
|
package main

   import (
       "net/http"
	"time"
	"log"
	"math"
	"github.com/prometheus/client_golang/prometheus"
       "github.com/prometheus/client_golang/prometheus/promhttp"
   )

   var (
	MyTestHistogramVec = prometheus.NewHistogramVec(prometheus.HistogramOpts{
		Name: "human_weight_histogram",
		Help: "human weight histogram",
		Buckets: prometheus.LinearBuckets(1, 10, 15), //第一个桶1起,每个桶间隔10, 共15个桶。 所以1,11,21,31,...,141
	},[]string{"sex","age","race"},)
   )

   func main() {
	prometheus.MustRegister(MyTestHistogramVec)
       go func(){
		var i float64
           for i < 20 {
               //不要太在意赋的什么值了,随便写的,主要为了了解用法
			MyTestHistogramVec.With(prometheus.Labels{"sex":"man","age":"20","race":"black"}).Observe(90 + math.Floor(400*math.Sin(float64(i*127)*0.1))/10)
			MyTestHistogramVec.With(prometheus.Labels{"sex":"woman","age":"20","race":"black"}).Observe(70 + math.Floor(400*math.Sin(float64(i*127)*0.1))/10)
			MyTestHistogramVec.With(prometheus.Labels{"sex":"man","age":"25","race":"black"}).Observe(95 + math.Floor(400*math.Sin(float64(i*127)*0.1))/10)
			MyTestHistogramVec.With(prometheus.Labels{"sex":"woman","age":"25","race":"black"}).Observe(95 + math.Floor(400*math.Sin(float64(i*127)*0.1))/10)
			MyTestHistogramVec.With(prometheus.Labels{"sex":"man","age":"20","race":"yellow"}).Observe(90 + math.Floor(400*math.Sin(float64(i*127)*0.1))/10)
			time.Sleep(time.Second)
			i++
		}
	}()

       http.Handle("/metrics", promhttp.Handler())
    log.Fatal(http.ListenAndServe("0.0.0.0:8080", nil)
   }
|
Func
默认情况下, Collector都是主动去计数, 但有的指标无法主动计数, 比如监控服务当前打开的DB连接数, 这个指标更适合在拉取指标时去获取值, 这个时候就可以使用prometheus.NewCounterFunc prometheus.NewGaugeFunc, 传入一个返回指标值的函数func() float64, 在拉取指标时就会调用这个函数.
自定义Collector
go client Colletor只会在每次响应pro请求的时候才收集数据,并且需要每次显式传递变量的值,否则就不会再维持该变量,在pro也将看不到这个变量,Collector是一个接口,所有收集metrics数据的对象都需要实现这个接口,Counter和Gauage等不例外,它内部提供了两个函数,Collector用于收集用户数据,将收集好的数据传递给传入参数Channel就可,Descirbe函数用于描述这个Collector。当收集系统数据代价较大时,就可以自定义Collector收集的方式,优化流程,并且在某些情况下如果已经有了一个成熟的metrics,就不需要使用Counter,Gauage等这些数据结构,直接在Collector内部实现一个代理的功能即可,一些高阶的用法都可以通过自定义Collector实现。
 1
 2
 3
 4
 5
 6
 7
 8
 9
10
11
12
13
14
15
16
17
18
19
20
21
22
23
24
25
26
27
28
29
30
31
32
33
34
35
36
37
38
39
40
41
42
43
44
45
46
47
48
49
50
51
52
53
54
55
56
57
58
59
60
61
62
63
64
65
66
67
68
69
70
71
72
73
74
75
76
77
78
79
80
81
82
83
84
85
86
87
88
89
90
91
92
93
94
95
|
package main

import (
	"github.com/prometheus/client_golang/prometheus"
	"github.com/prometheus/client_golang/prometheus/promhttp"
	"net/http"
)

type ClusterManager struct {
	Zone         string
	OOMCountDesc *prometheus.Desc
	RAMUsageDesc *prometheus.Desc
	// ... many more fields
}

// Simulate prepare the data
func (c *ClusterManager) ReallyExpensiveAssessmentOfTheSystemState() (
	oomCountByHost map[string]int, ramUsageByHost map[string]float64,
) {
	// Just example fake data.
	oomCountByHost = map[string]int{
		"foo.example.org": 42,
		"bar.example.org": 2001,
	}
	ramUsageByHost = map[string]float64{
		"foo.example.org": 6.023e23,
		"bar.example.org": 3.14,
	}
	return
}

// Describe simply sends the two Descs in the struct to the channel.
func (c *ClusterManager) Describe(ch chan<- *prometheus.Desc) {
	ch <- c.OOMCountDesc
	ch <- c.RAMUsageDesc
}

func (c *ClusterManager) Collect(ch chan<- prometheus.Metric) {
	oomCountByHost, ramUsageByHost := c.ReallyExpensiveAssessmentOfTheSystemState()
	for host, oomCount := range oomCountByHost {
		ch <- prometheus.MustNewConstMetric(
			c.OOMCountDesc,
			prometheus.CounterValue,
			float64(oomCount),
			host,
		)
	}
	for host, ramUsage := range ramUsageByHost {
		ch <- prometheus.MustNewConstMetric(
			c.RAMUsageDesc,
			prometheus.GaugeValue,
			ramUsage,
			host,
		)
	}
}

// NewClusterManager creates the two Descs OOMCountDesc and RAMUsageDesc. Note
// that the zone is set as a ConstLabel. (It's different in each instance of the
// ClusterManager, but constant over the lifetime of an instance.) Then there is
// a variable label "host", since we want to partition the collected metrics by
// host. Since all Descs created in this way are consistent across instances,
// with a guaranteed distinction by the "zone" label, we can register different
// ClusterManager instances with the same registry.
func NewClusterManager(zone string) *ClusterManager {
	return &ClusterManager{
		Zone: zone,
		OOMCountDesc: prometheus.NewDesc(
			"clustermanager_oom_crashes_total",
			"Number of OOM crashes.",
			[]string{"host"},
			prometheus.Labels{"zone": zone},
		),
		RAMUsageDesc: prometheus.NewDesc(
			"clustermanager_ram_usage_bytes",
			"RAM usage as reported to the cluster manager.",
			[]string{"host"},
			prometheus.Labels{"zone": zone},
		),
	}
}

func main() {
	workerDB := NewClusterManager("db")
	workerCA := NewClusterManager("ca")

	// Since we are dealing with custom Collector implementations, it might
	// be a good idea to try it out with a pedantic registry.
	reg := prometheus.NewPedanticRegistry()
	reg.MustRegister(workerDB)
	reg.MustRegister(workerCA)

	http.Handle("/metrics", promhttp.HandlerFor(reg, promhttp.HandlerOpts{}))
	http.ListenAndServe(":8888", nil)
}
|
此时就可以去 http://localhost:8888/metrics 看到传递过去的数据了。示例中定义了两个matrics, host和zone分别是其label。 其实pro client内部提供了几个Collector供我们使用,我们可以参考他的实现,在源码包中可以找到go_collector.go, process_collecor.go, expvar_collector这三个文件的Collecor实现。
集成优化建议
在编辑图表写查询语句时,不会显示指标类型, 所以最好看到metric name就能知道是一个什么类型的指标, 约定counter类型的指标名字以_total为后缀.
在编辑图表写查询语句时, 也不会显示指标类型的单位, 所以最好看到metric name就能知道是一个什么单位的指标, 比如时长要写是纳秒还是毫秒还是秒, http_request_duration_seconds, 数据大小要写是MB还是bytes, client_grpc_sent_bytes_total.
每个指标要有单个词的namespace前缀, 比如process_cpu_seconds_total, http_request_duration_seconds.
客户端集成时,需要关注采集监控数据对程序性能和可靠性的影响,同时也需要关注数据完备性,即采集到的数据应完整、正确地反映监控对象的状态和变化,笔者提出以下两点思路:
- 为监控对象定义“恰当”的监控数据集,“恰当”要求在详细设计阶段梳理并细化整个监控对象,不引入多余的监控数据,也不应该出现监控盲点
- 根据每个监控数据的实际情况选择合理的数据结构
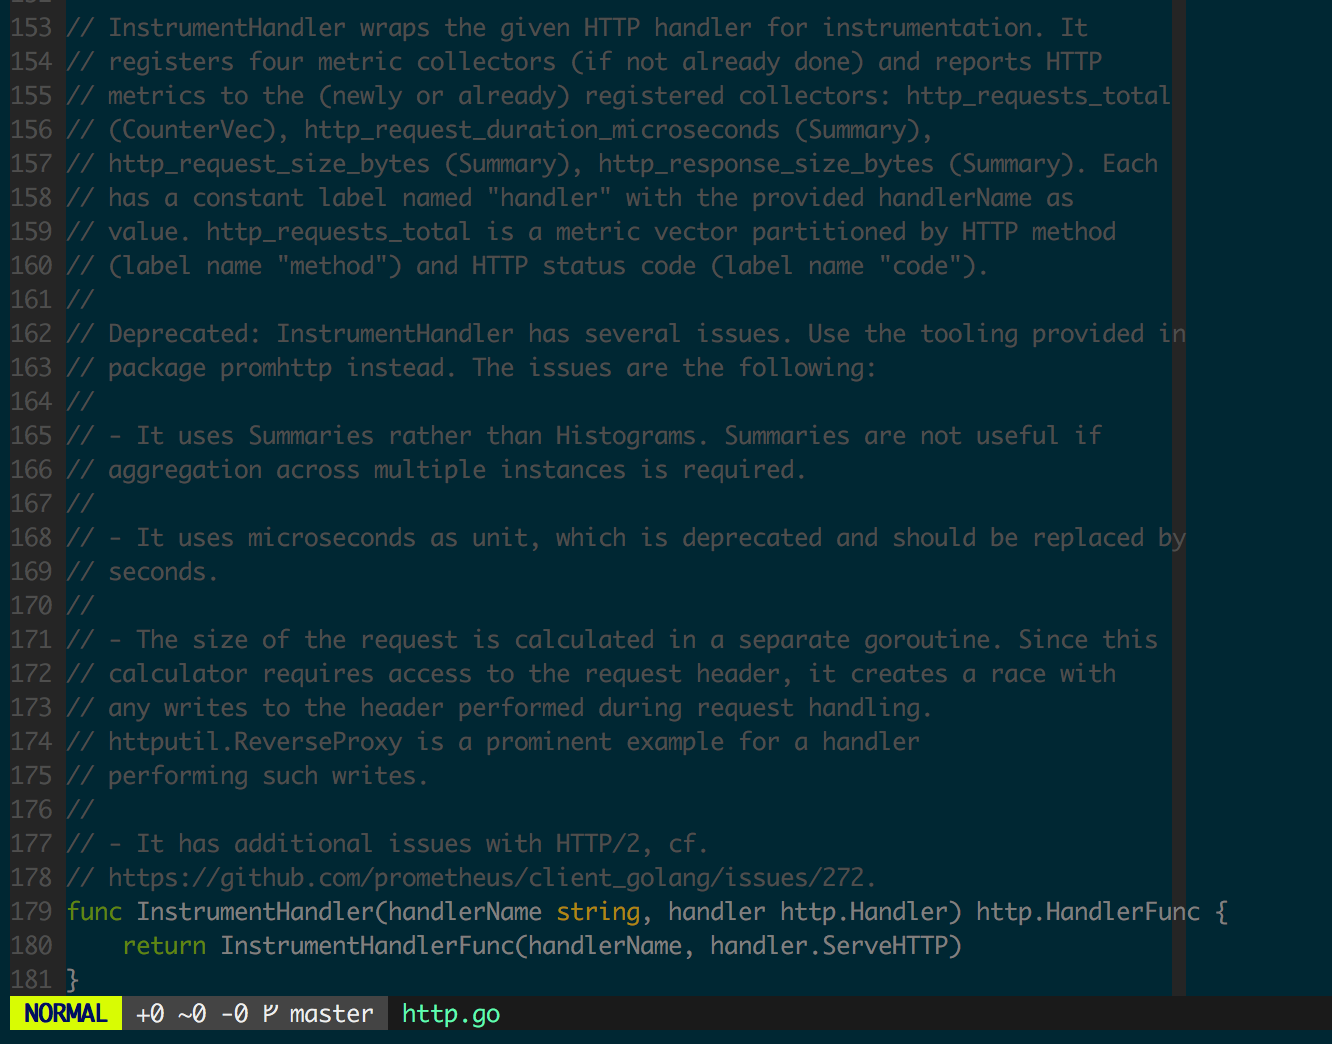
Go 客户端为 HTTP 层的集成提供了方便的 API,但使用中需要注意不要使用 github.com/prometheus/client_golang/prometheus 下定义的已经 deprecated 的 Instrument 函数(如图 1.5.1 中注释部分),除了会引入额外(通常不需要)的监控数据,不仅会对程序性能造成不利影响,而且可能存在危险的 race(如计算请求大小时存在 goroutine 并发地访问 Header 逻辑)。
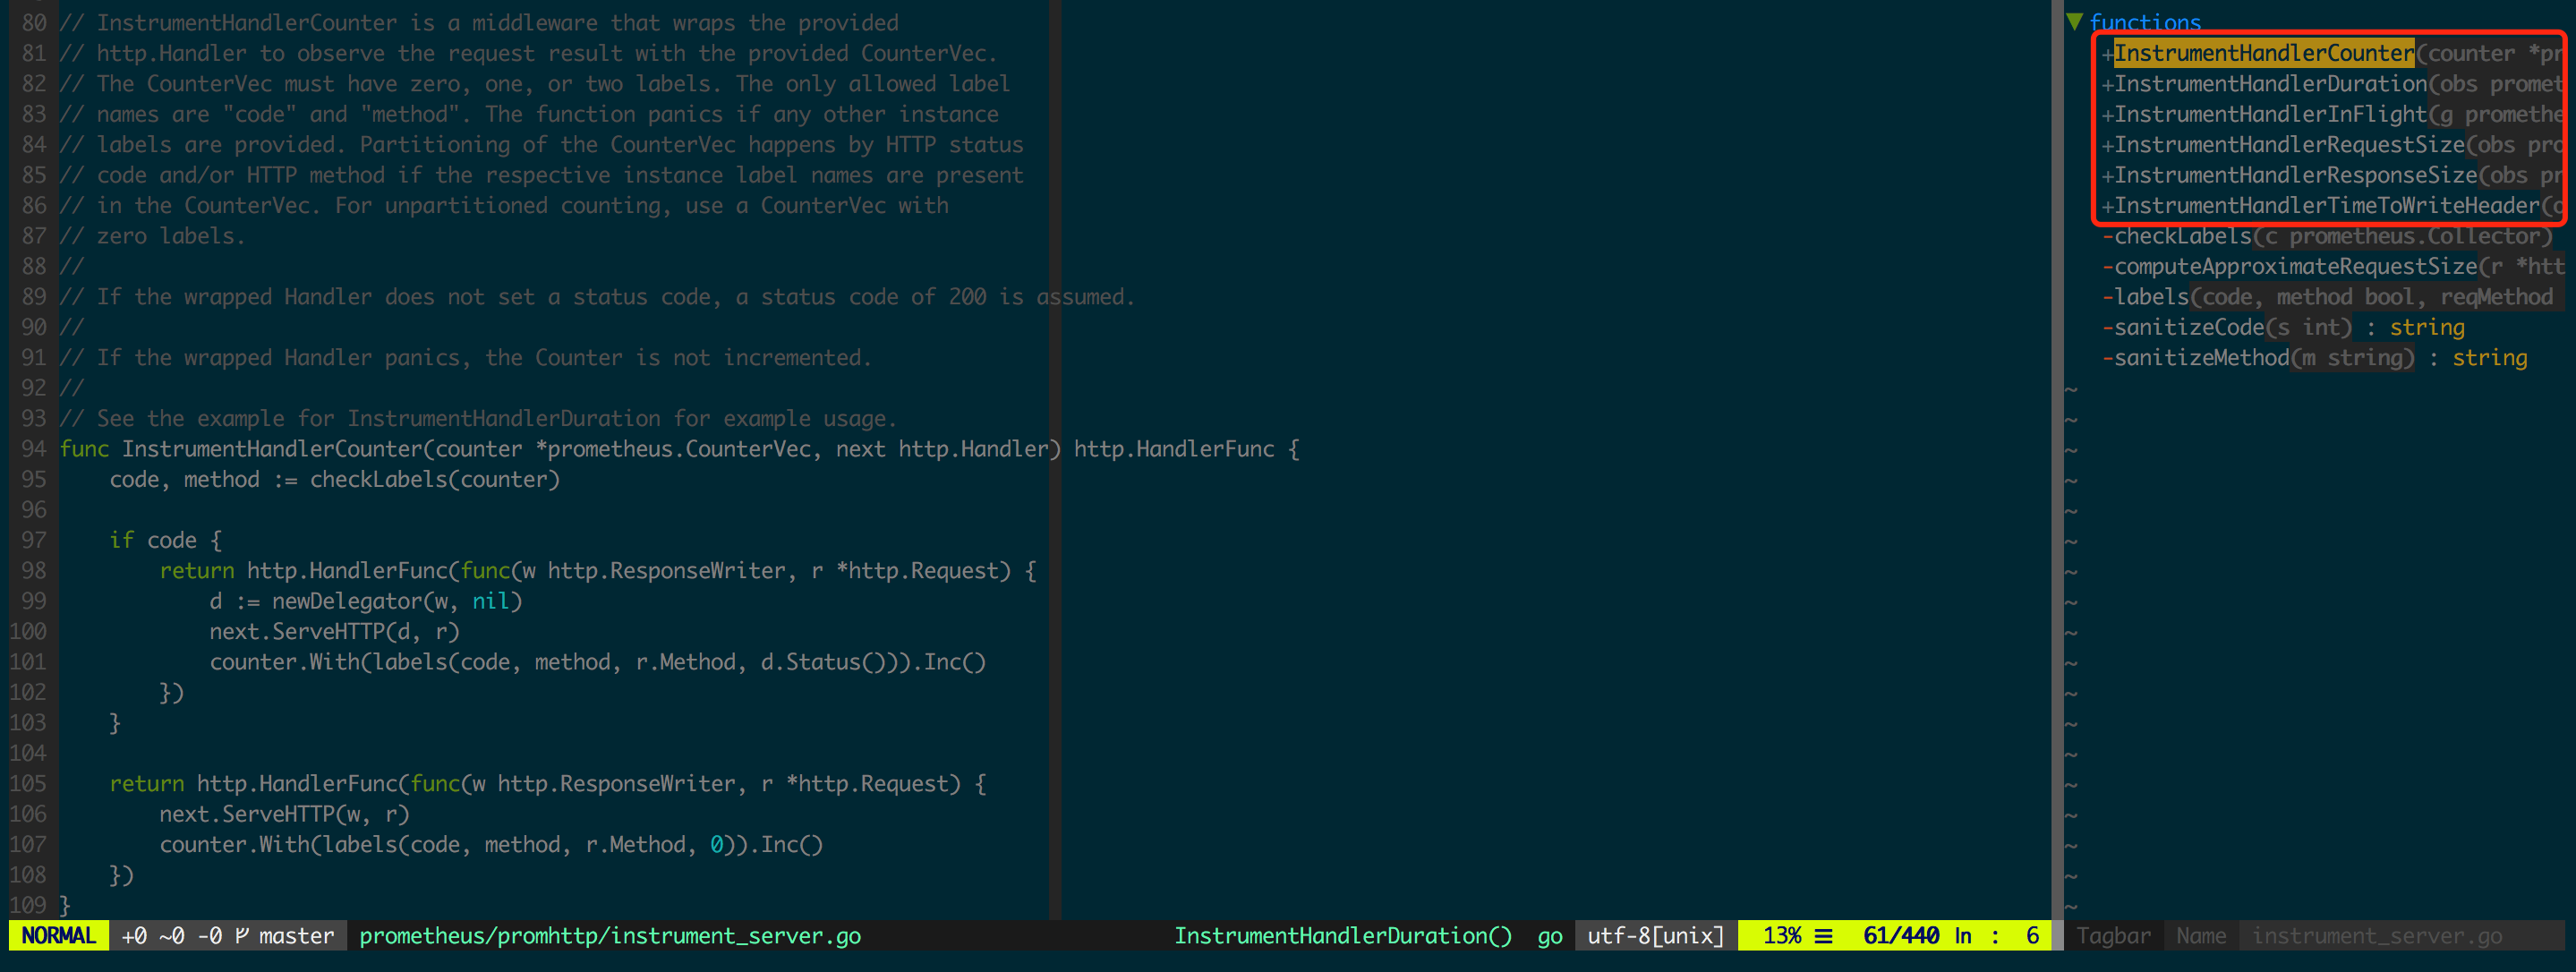
Go 客户端在后续的版本中给出了优化的 API,即 github.com/prometheus/client_golang/prometheus/promhttp 下的实现,为 HTTP Handler 的不同监控数据定义了独立的 InstrumentHandlerXXX(图 1.5.2),让监控数据集保持灵活可控,完全规避了图 1.5.1 中提到的几个问题。
另外一个难点是根据实际使用场景,从 Histogram 和 Summary 中作出选择以及给予合理的初始化配置。
Histogram 常使用 histogram_quantile 执行数据分析, histogram_quantile 函数通过分段线性近似模型逼近采样数据分布的 UpperBound(如图 1.5.3),误差是比较大的,其中红色曲线为实际的采样分布(正态分布),而实心圆点是 Histogram 的 bucket(0.01 0.25 0.50 0.75 0.95),当求解 0.9 quantile 的采样值时会用 (0.75, 0.95) 两个相邻的的 bucket 来线性近似。
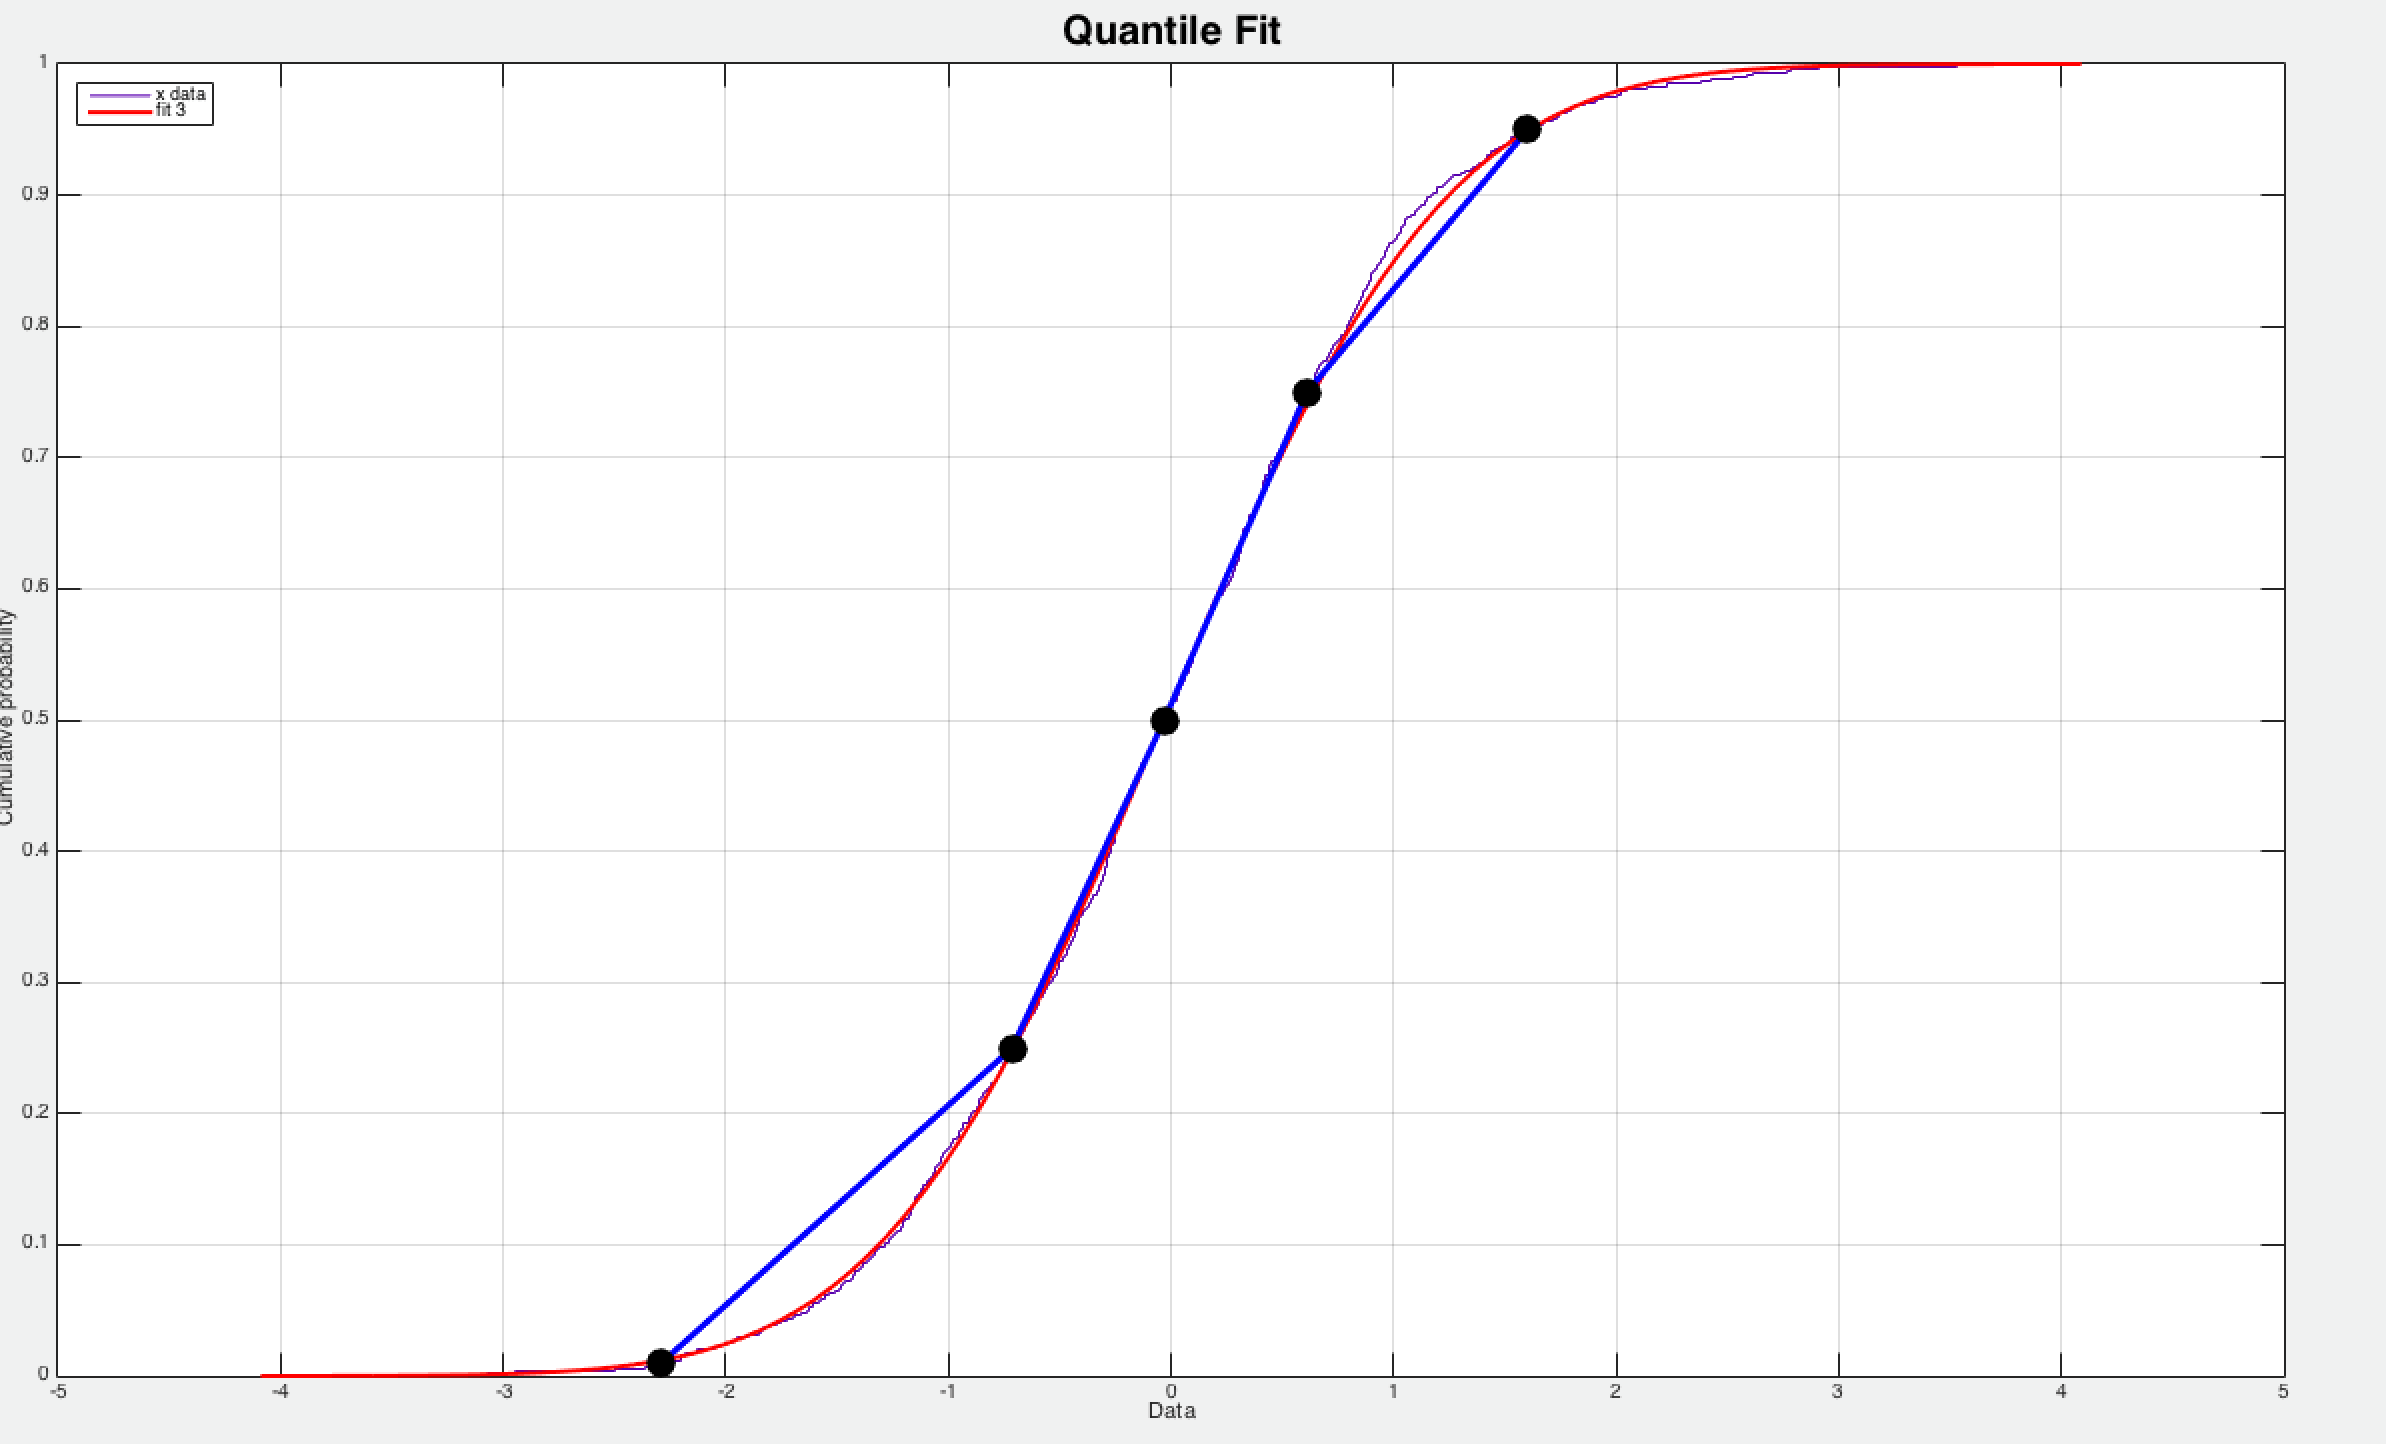
而 Summary 的分位点是客户端预先定义好的,已知分位点可以求该分位点的采样值,相比 Histogram 而言能更准确地获取分位点的采样值。
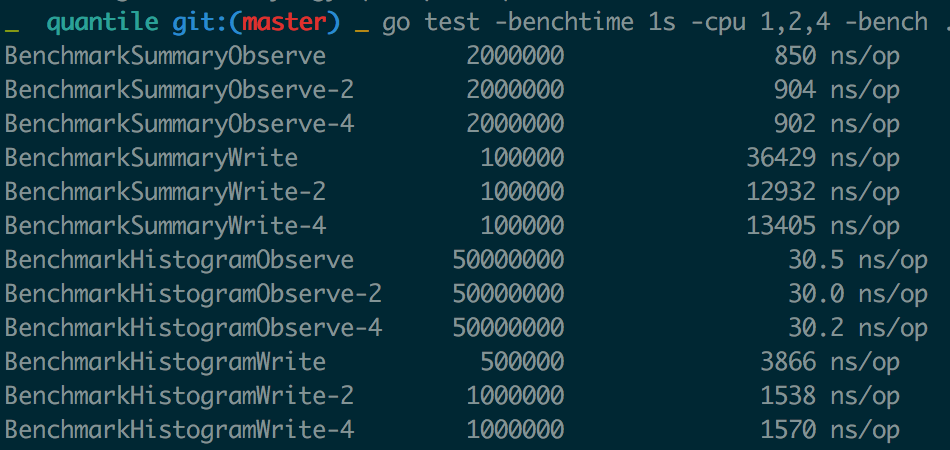
当然,Summary 精度高的代价是在客户端增加了额外的计算开销,而且 Summary 结构有频繁的全局锁操作,对高并发程序性能存在一定影响,图 1.5.4 是对 Histogram 和 Summary 分析 Benchmark 的结果,Observe 和 Write 操作都有着指数级别的差异,需要结合实际应用场景作出选择。
带label的每次会去计算label值的hash找到对应的向量, 然后去计数, 所以label数不要太多, label值的长度不要太长, label值是要可枚举的并且不能太多, 否则执行查询时慢, 面板加载慢, 存储也费空间. label如果可以提前计算则尽量使用GetMetricWithLabelValues提前计算好得到一个普通的计数器, 减少每次计数的一次计算label的hash, 提升程序性能.
对于时长time.Duration数据类型的指标值收集, time.Since是优化过的, 直接走runtimeNano, 无需走系统调用取当前时间, 性能优于time.Now后相减, 另外, 频繁调用time.Now在性能要求高的程序中也会变成不小的开销.
参考:
Prometheus 原理和源码分析
浅谈prometheus client golang