前言
关于Go的内存泄露有这么一句话不知道你听过没有:
10次内存泄露,有9次是goroutine泄露。
我所解决的问题,也是goroutine泄露导致的内存泄露,所以这篇文章主要介绍Go程序的goroutine泄露,掌握了如何定位和解决goroutine泄露,就掌握了内存泄露的大部分场景。
什么是内存泄露
内存泄露指的是程序运行过程中已不再使用的内存,没有被释放掉,导致这些内存无法被使用,直到程序结束这些内存才被释放的问题。
Go虽然有GC来回收不再使用的堆内存,减轻了开发人员对内存的管理负担,但这并不意味着Go程序不再有内存泄露问题。在Go程序中,如果没有Go语言的编程思维,也不遵守良好的编程实践,就可能埋下隐患,造成内存泄露问题。
怎么发现内存泄露
在Go中发现内存泄露有2种方法,一个是通用的监控工具,另一个是go pprof:
- 监控工具:固定周期对进程的内存占用情况进行采样,数据可视化后,根据内存占用走势(持续上升),很容易发现是否发生内存泄露。
- go pprof:适合没有监控工具的情况,使用Go提供的pprof工具判断是否发生内存泄露。
这2种方式分别介绍一下。
监控工具查看进程内在占用情况
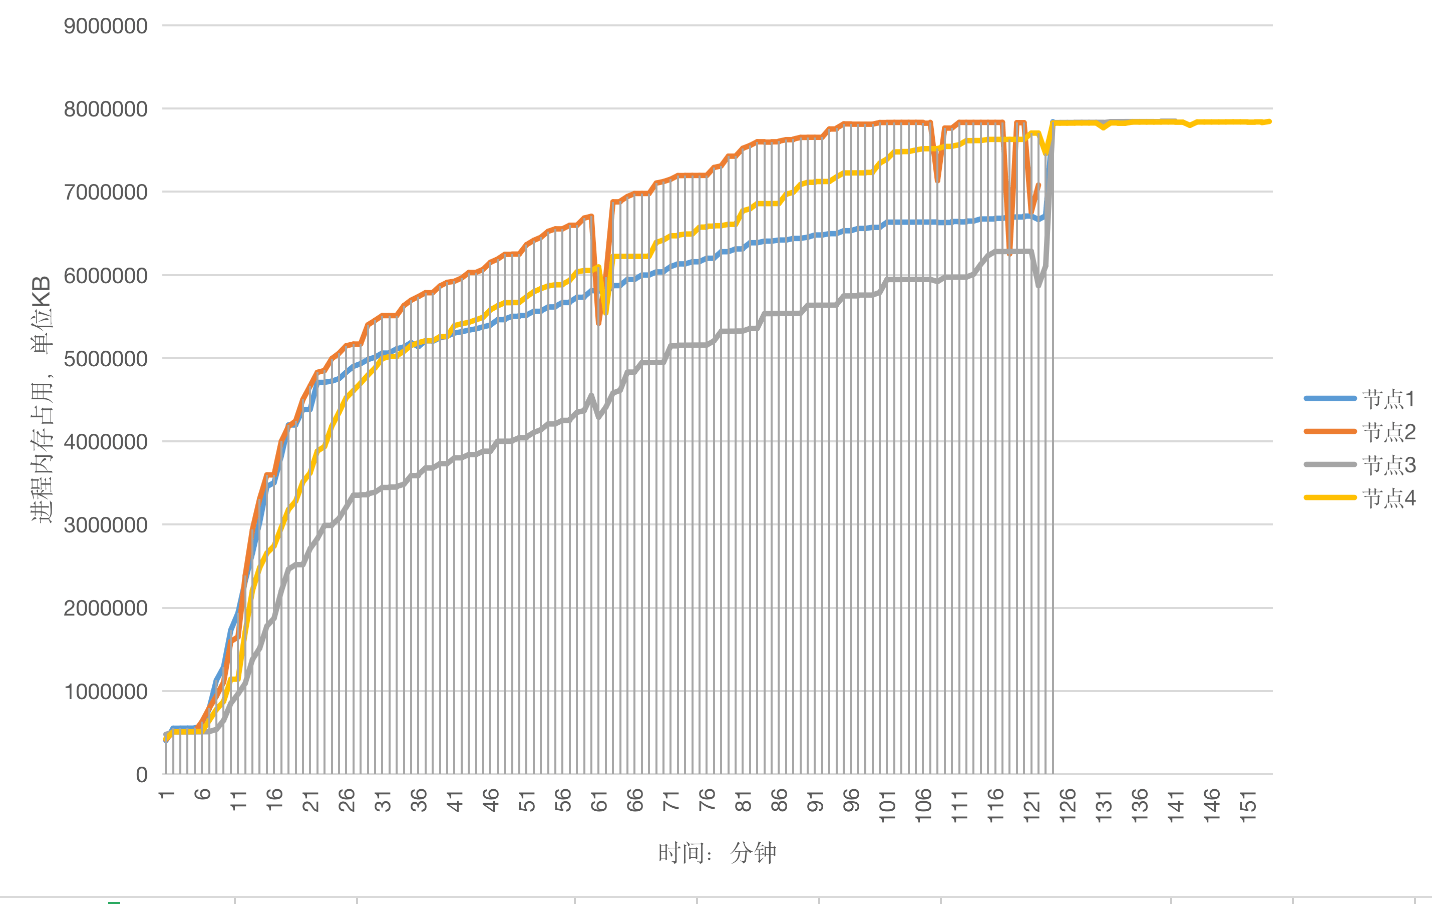
如果使用云平台部署Go程序,云平台都提供了内存查看的工具,可以查看OS的内存占用情况和某个进程的内存占用情况,比如阿里云,我们在1个云主机上只部署了1个Go服务,所以OS的内存占用情况,基本是也反映了进程内存占用情况,OS内存占用情况如下,可以看到随着时间的推进,内存的占用率在不断的提高,这是内存泄露的最明显现象:

如果没有云平台这种内存监控工具,可以制作一个简单的内存记录工具。
1、建立一个脚本prog_mem.sh,获取进程占用的物理内存情况,脚本内容如下:
1
2
3
4
5
|
#!/bin/bash
prog_name="your_programe_name"
prog_mem=$(pidstat  -r -u -h -C $prog_name |awk 'NR==4{print $12}')
time=$(date "+%Y-%m-%d %H:%M:%S")
echo $time"\tmemory(Byte)\t"$prog_mem >>~/record/prog_mem.log
|
2、然后使用crontab建立定时任务,每分钟记录1次。使用crontab -e编辑crontab配置,在最后增加1行:
1
|
*/1 * * * * ~/record/prog_mem.sh
|
脚本输出的内容保存在prog_mem.log,只要大体浏览一下就可以发现内存的增长情况,判断是否存在内存泄露。如果需要可视化,可以直接黏贴prog_mem.log内容到Excel等表格工具,绘制内存占用图。
go pprof发现存在内存问题
如果你Google或者百度,Go程序内存泄露的文章,它总会告诉你使用pprof heap,能够生成漂亮的调用路径图,火焰图等等,然后你根据调用路径就能定位内存泄露问题,我最初也是对此深信不疑,尝试了若干天后,只是发现内存泄露跟某种场景有关,根本找不到内存泄露的根源,如果哪位朋友用heap就能定位内存泄露的线上问题,麻烦介绍下。
后来读了Dave的《High Performance Go Workshop》,刷新了对heap的认识,内存pprof的简要内容如下:
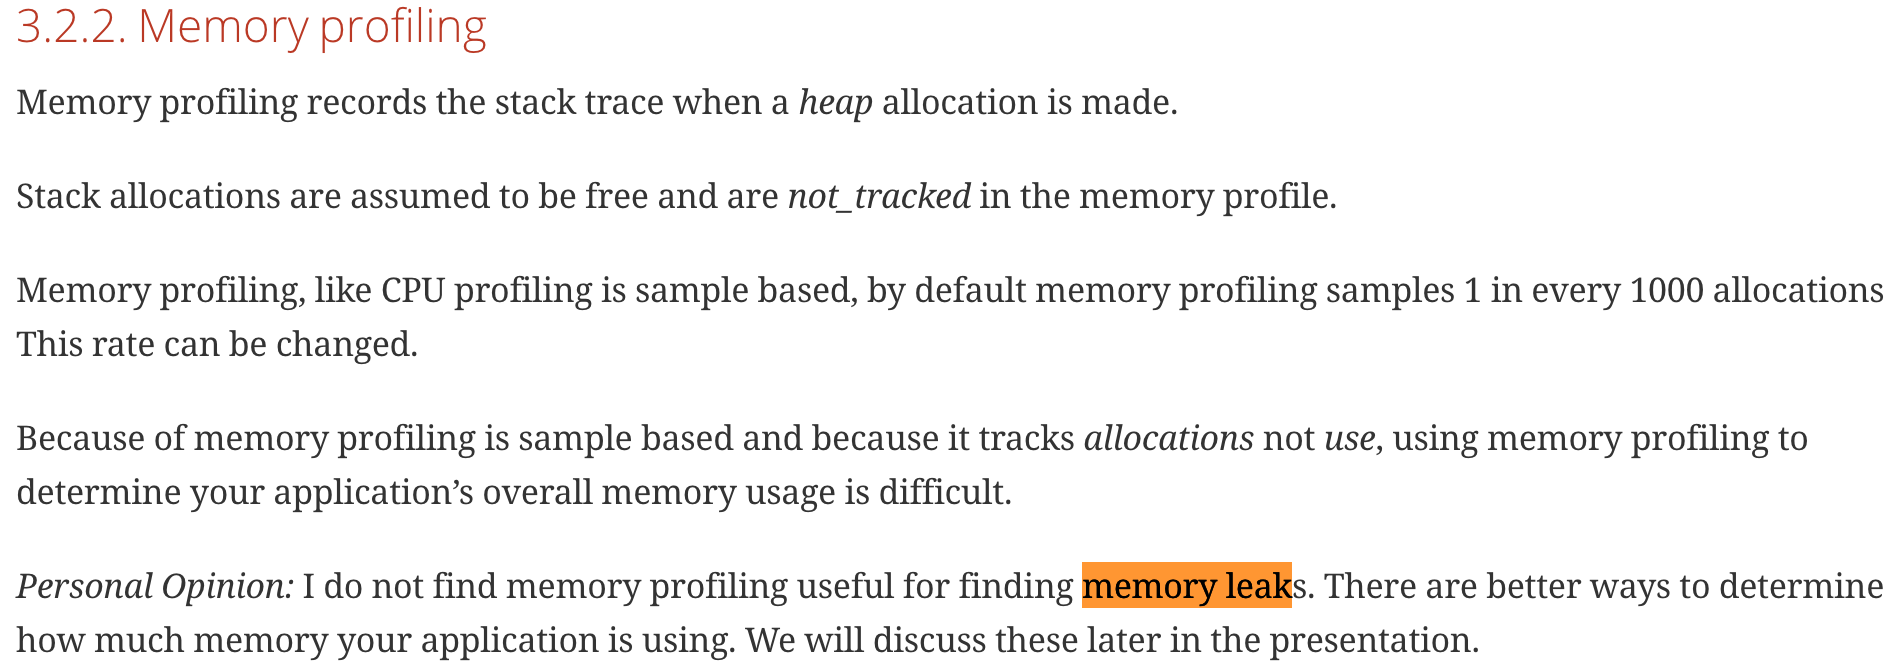
Dave讲了以下几点:
- 内存profiling记录的是堆内存分配的情况,以及调用栈信息,并不是进程完整的内存情况,猜测这也是在go pprof中称为heap而不是memory的原因。
- 栈内存的分配是在调用栈结束后会被释放的内存,所以并不在内存profile中。
- 内存profiling是基于抽样的,默认是每1000次堆内存分配,执行1次profile记录。
- 因为内存profiling是基于抽样和它跟踪的是已分配的内存,而不是使用中的内存,(比如有些内存已经分配,看似使用,但实际已经不使用的内存,比如内存泄露的那部分),所以不能使用内存profiling衡量程序总体的内存使用情况。
- Dave个人观点:使用内存profiling不能够发现内存泄露。
基于目前对heap的认知,我有2个观点:
- heap能帮助我们发现内存问题,但不一定能发现内存泄露问题,这个看法与Dave是类似的。heap记录了内存分配的情况,我们能通过heap观察内存的变化,增长与减少,内存主要被哪些代码占用了,程序存在内存问题,这只能说明内存有使用不合理的地方,但并不能说明这是内存泄露。
- heap在帮助定位内存泄露原因上贡献的力量微乎其微。如第一条所言,能通过heap找到占用内存多的位置,但这个位置通常不一定是内存泄露,就算是内存泄露,也只是内存泄露的结果,并不是真正导致内存泄露的根源。
接下来,我介绍怎么用heap发现问题,然后再解释为什么heap几乎不能定位内存泄露的根因。
怎么用heap发现内存问题
使用pprof的heap能够获取程序运行时的内存信息,在程序平稳运行的情况下,每个一段时间使用heap获取内存的profile,然后使用base能够对比两个profile文件的差别,就像diff命令一样显示出增加和减少的变化,使用一个简单的demo来说明heap和base的使用:
 1
 2
 3
 4
 5
 6
 7
 8
 9
10
11
12
13
14
15
16
17
18
19
20
21
22
23
24
25
26
27
28
|
// 展示内存增长和pprof,并不是泄露
package main

import (
	"fmt"
	"net/http"
	_ "net/http/pprof"
	"os"
	"time"
)

// 运行一段时间:fatal error: runtime: out of memory
func main() {
	// 开启pprof
	go func() {
		ip := "0.0.0.0:6060"
		if err := http.ListenAndServe(ip, nil); err != nil {
			fmt.Printf("start pprof failed on %s\n", ip)
			os.Exit(1)
		}
	}()

	tick := time.Tick(time.Second / 100)
	var buf []byte
	for range tick {
		buf = append(buf, make([]byte, 1024*1024)...)
	}
}
|
将上面代码运行起来,执行以下命令获取profile文件,Ctrl-D退出,1分钟后再获取1次。
1
|
go tool pprof http://localhost:6060/debug/pprof/heap
|
我已经获取到了两个profile文件:
1
2
3
|
$ ls
pprof.demo2.alloc_objects.alloc_space.inuse_objects.inuse_space.001.pb.gz
pprof.demo2.alloc_objects.alloc_space.inuse_objects.inuse_space.002.pb.gz
|
使用base把001文件作为基准,然后用002和001对比,先执行top看top的对比,然后执行list main列出main函数的内存对比,结果如下:
 1
 2
 3
 4
 5
 6
 7
 8
 9
10
11
12
13
14
15
16
17
18
19
20
21
22
23
24
25
26
27
28
|
$ go tool pprof -base pprof.demo2.alloc_objects.alloc_space.inuse_objects.inuse_space.001.pb.gz pprof.demo2.alloc_objects.alloc_space.inuse_objects.inuse_space.002.pb.gz

File: demo2
Type: inuse_space
Time: May 14, 2019 at 2:33pm (CST)
Entering interactive mode (type "help" for commands, "o" for options)
(pprof)
(pprof)
(pprof) top
Showing nodes accounting for 970.34MB, 32.30% of 3003.99MB total
      flat  flat%   sum%        cum   cum%
  970.34MB 32.30% 32.30%   970.34MB 32.30%  main.main   // 看这
         0     0% 32.30%   970.34MB 32.30%  runtime.main
(pprof)
(pprof)
(pprof) list main.main
Total: 2.93GB
ROUTINE ======================== main.main in /home/ubuntu/heap/demo2.go
  970.34MB   970.34MB (flat, cum) 32.30% of Total
         .          .     20:	}()
         .          .     21:
         .          .     22:	tick := time.Tick(time.Second / 100)
         .          .     23:	var buf []byte
         .          .     24:	for range tick {
  970.34MB   970.34MB     25:		buf = append(buf, make([]byte, 1024*1024)...) // 看这
         .          .     26:	}
         .          .     27:}
         .          .     28:
|
top列出了main.main和runtime.main,main.main就是我们编写的main函数,runtime.main是runtime包中的main函数,也就是所有main函数的入口.
top显示main.main 第2次内存占用,比第1次内存占用多了970.34MB。
list main.main告诉了我们增长的内存都在这一行:
1
|
buf = append(buf, make([]byte, 1024*1024)...)
|
001和002 profile的文件不进去看了,你本地测试下计算差值,绝对是刚才对比出的970.34MB。
heap“不能”定位内存泄露
heap能显示内存的分配情况,以及哪行代码占用了多少内存,我们能轻易的找到占用内存最多的地方,如果这个地方的数值还在不断怎大,基本可以认定这里就是内存泄露的位置。
曾想按图索骥,从内存泄露的位置,根据调用栈向上查找,总能找到内存泄露的原因,这种方案看起来是不错的,但实施起来却找不到内存泄露的原因,结果是事半功倍。
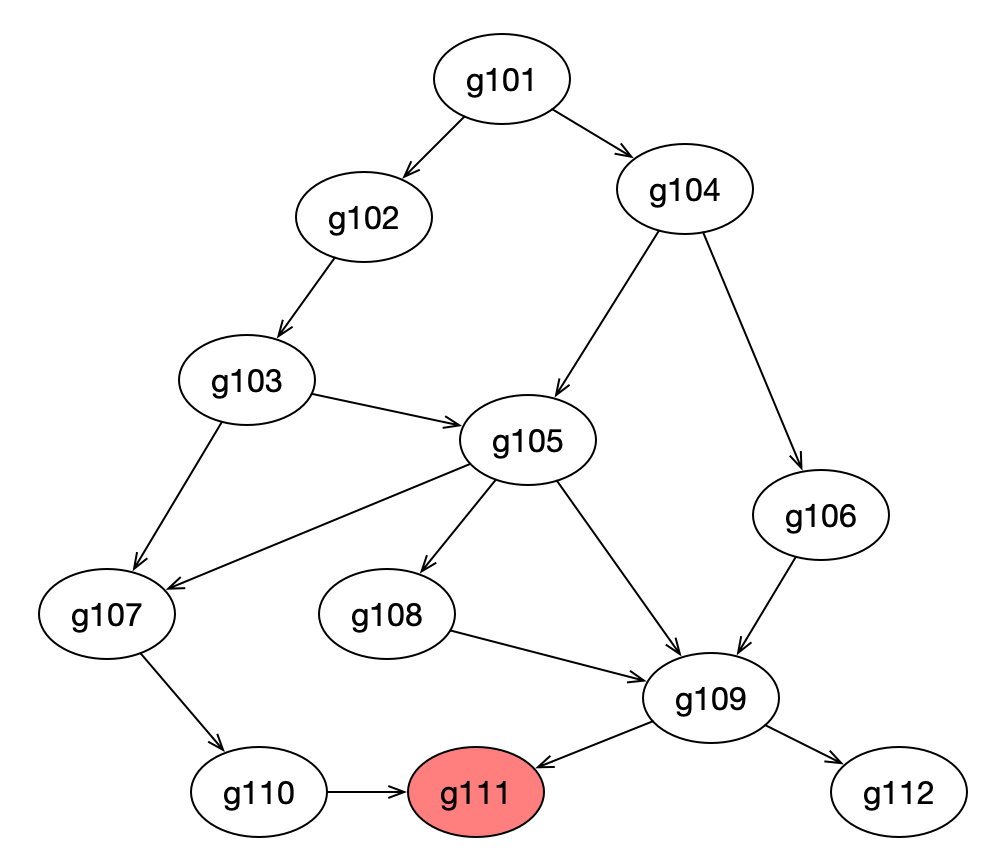
原因在于一个Go程序,其中有大量的goroutine,这其中的调用关系也许有点复杂,也许内存泄露是在某个三方包里。举个栗子,比如下面这幅图,每个椭圆代表1个goroutine,其中的数字为编号,箭头代表调用关系。heap profile显示g111(最下方标红节点)这个协程的代码出现了泄露,任何一个从g101到g111的调用路径都可能造成了g111的内存泄露,有2类可能:
- 该goroutine只调用了少数几次,但消耗了大量的内存,说明每个goroutine调用都消耗了不少内存,内存泄露的原因基本就在该协程内部。
- 该goroutine的调用次数非常多,虽然每个协程调用过程中消耗的内存不多,但该调用路径上,协程数量巨大,造成消耗大量的内存,并且这些goroutine由于某种原因无法退出,占用的内存不会释放,内存泄露的原因在到g111调用路径上某段代码实现有问题,造成创建了大量的g111。
第2种情况,就是goroutine泄露,这是通过heap无法发现的,所以heap在定位内存泄露这件事上,发挥的作用不大。
什么是goroutine泄露
如果你启动了1个goroutine,但并没有符合预期的退出,直到程序结束,此goroutine才退出,这种情况就是goroutine泄露。
goroutine泄露怎么导致内存泄露
每个goroutine占用2KB内存,泄露1百万goroutine至少泄露2KB * 1000000 = 2GB内存,为什么说至少呢?
goroutine执行过程中还存在一些变量,如果这些变量指向堆内存中的内存,GC会认为这些内存仍在使用,不会对其进行回收,这些内存谁都无法使用,造成了内存泄露。
所以goroutine泄露有2种方式造成内存泄露:
- goroutine本身的栈所占用的空间造成内存泄露。
- goroutine中的变量所占用的堆内存导致堆内存泄露,这一部分是能通过heap profile体现出来的。
Dave在文章中也提到了,如果不知道何时停止一个goroutine,这个goroutine就是潜在的内存泄露:
1
2
3
|
7.1.1 Know when to stop a goroutine

If you don’t know the answer, that’s a potential memory leak as the goroutine will pin its stack’s memory on the heap, as well as any heap allocated variables reachable from the stack.
|
怎么确定是goroutine泄露引发的内存泄露
掌握了前面的pprof命令行的基本用法,很快就可以确认是否是goroutine泄露导致内存泄露.
判断依据:在节点正常运行的情况下,隔一段时间获取goroutine的数量,如果后面获取的那次,某些goroutine比前一次多,如果多获取几次,是持续增长的,就极有可能是goroutine泄露。
goroutine导致内存泄露的demo:
 1
 2
 3
 4
 5
 6
 7
 8
 9
10
11
12
13
14
15
16
17
18
19
20
21
22
23
24
25
26
27
28
29
30
31
32
33
34
35
36
37
38
39
40
41
42
43
44
45
46
47
48
49
50
51
52
53
54
55
|
// goroutine泄露导致内存泄露
package main

import (
	"fmt"
	"net/http"
	_ "net/http/pprof"
	"os"
	"time"
)

func main() {
	// 开启pprof
	go func() {
		ip := "0.0.0.0:6060"
		if err := http.ListenAndServe(ip, nil); err != nil {
			fmt.Printf("start pprof failed on %s\n", ip)
			os.Exit(1)
		}
	}()

	outCh := make(chan int)
	// 死代码,永不读取
	go func() {
		if false {
			<-outCh
		}
		select {}
	}()

	// 每s起100个goroutine,goroutine会阻塞,不释放内存
	tick := time.Tick(time.Second / 100)
	i := 0
	for range tick {
		i++
		fmt.Println(i)
		alloc1(outCh)
	}
}

func alloc1(outCh chan<- int) {
	go alloc2(outCh)
}

func alloc2(outCh chan<- int) {
	func() {
		defer fmt.Println("alloc-fm exit")
		// 分配内存,假用一下
		buf := make([]byte, 1024*1024*10)
		_ = len(buf)
		fmt.Println("alloc done")

		outCh <- 0 // 53行
	}()
}
|
编译并运行以上代码,然后使用go tool pprof获取gorourine的profile文件。
1
|
go tool pprof http://localhost:6060/debug/pprof/goroutine
|
已经通过pprof命令获取了2个goroutine的profile文件:
1
2
3
|
$ ls
/home/ubuntu/pprof/pprof.leak_demo.goroutine.001.pb.gz
/home/ubuntu/pprof/pprof.leak_demo.goroutine.002.pb.gz
|
同heap一样,我们可以使用base对比2个goroutine profile文件:
 1
 2
 3
 4
 5
 6
 7
 8
 9
10
11
12
13
14
15
16
17
|
$go tool pprof -base pprof.leak_demo.goroutine.001.pb.gz pprof.leak_demo.goroutine.002.pb.gz

File: leak_demo
Type: goroutine
Time: May 16, 2019 at 2:44pm (CST)
Entering interactive mode (type "help" for commands, "o" for options)
(pprof)
(pprof) top
Showing nodes accounting for 20312, 100% of 20312 total
      flat  flat%   sum%        cum   cum%
     20312   100%   100%      20312   100%  runtime.gopark
         0     0%   100%      20312   100%  main.alloc2
         0     0%   100%      20312   100%  main.alloc2.func1
         0     0%   100%      20312   100%  runtime.chansend
         0     0%   100%      20312   100%  runtime.chansend1
         0     0%   100%      20312   100%  runtime.goparkunlock
(pprof)
|
可以看到运行到runtime.gopark的goroutine数量增加了20312个。再通过002文件,看一眼执行到gopark的goroutine数量,即挂起的goroutine数量:
 1
 2
 3
 4
 5
 6
 7
 8
 9
10
11
12
13
14
15
|
go tool pprof pprof.leak_demo.goroutine.002.pb.gz
File: leak_demo
Type: goroutine
Time: May 16, 2019 at 2:47pm (CST)
Entering interactive mode (type "help" for commands, "o" for options)
(pprof) top
Showing nodes accounting for 24330, 100% of 24331 total
Dropped 32 nodes (cum <= 121)
      flat  flat%   sum%        cum   cum%
     24330   100%   100%      24330   100%  runtime.gopark
         0     0%   100%      24326   100%  main.alloc2
         0     0%   100%      24326   100%  main.alloc2.func1
         0     0%   100%      24326   100%  runtime.chansend
         0     0%   100%      24326   100%  runtime.chansend1
         0     0%   100%      24327   100%  runtime.goparkunlock
|
显示有24330个goroutine被挂起,这不是goroutine泄露这是啥?已经能确定八九成goroutine泄露了。
是什么导致如此多的goroutine被挂起而无法退出?接下来就看怎么定位goroutine泄露。
定位goroutine泄露的2种方法
使用pprof有2种方式,一种是web网页,一种是go tool pprof命令行交互,这两种方法查看goroutine都支持,但有轻微不同,也有各自的优缺点。
我们先看Web的方式,再看命令行交互的方式,这两种都很好使用,结合起来用也不错。
Web可视化查看
Web方式适合web服务器的端口能访问的情况,使用起来方便,有2种方式:
- 查看某条调用路径上,当前阻塞在此goroutine的数量
- 查看所有goroutine的运行栈(调用路径),可以显示阻塞在此的时间
方式一
url请求中设置debug=1:
1
|
http://ip:port/debug/pprof/goroutine?debug=1
|
效果如下:
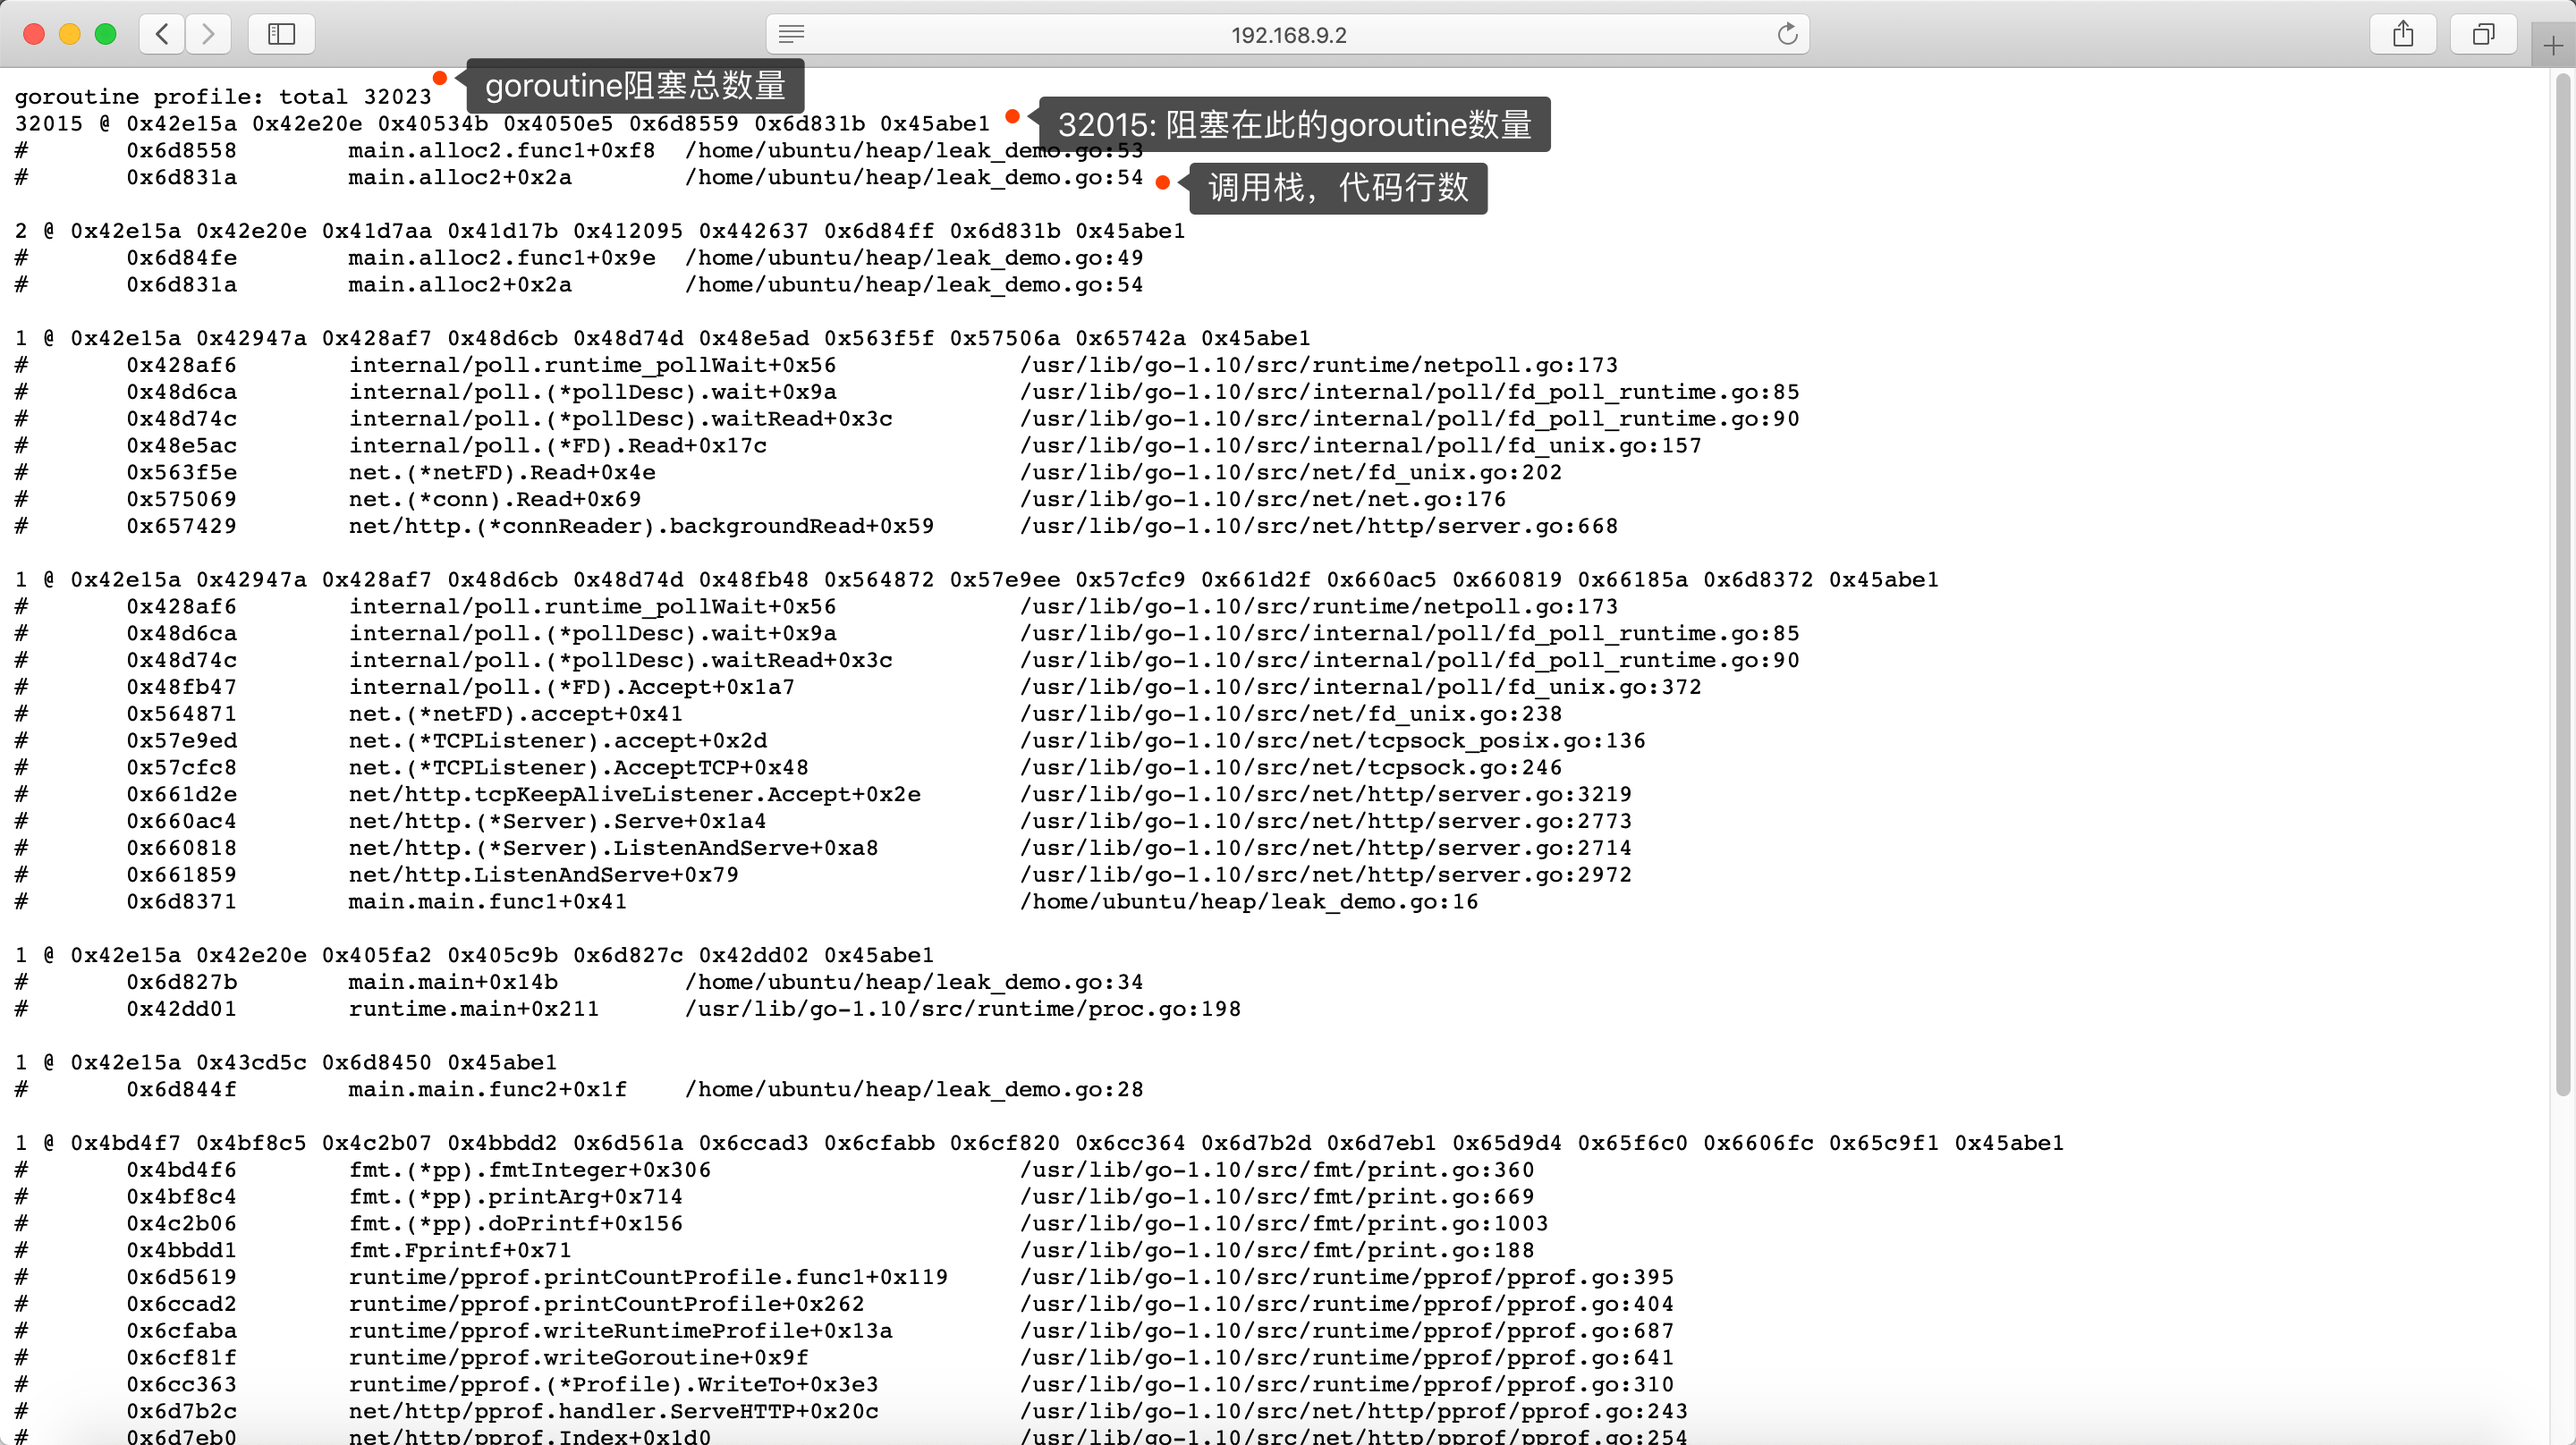
看起来密密麻麻的,其实简单又十分有用,看上图标出来的部分,手机上图看起来可能不方便,那就放大图片,或直接看下面各字段的含义:
- goroutine profile: total 32023:32023是goroutine的总数量,
- 32015 @ 0x42e15a 0x42e20e 0x40534b 0x4050e5 …:32015代表当前有32015个goroutine运行这个调用栈,并且停在相同位置,@后面的十六进制,现在用不到这个数据,所以暂不深究了。
- 下面是当前goroutine的调用栈,列出了函数和所在文件的行数,这个行数对定位很有帮助,如下:
1
2
3
|
32015 @ 0x42e15a 0x42e20e 0x40534b 0x4050e5 0x6d8559 0x6d831b 0x45abe1
#	0x6d8558	main.alloc2.func1+0xf8	/home/ubuntu/heap/leak_demo.go:53
#	0x6d831a	main.alloc2+0x2a	/home/ubuntu/heap/leak_demo.go:54
|
根据上面的提示,就能判断32015个goroutine运行到leak_demo.go的53行:
 1
 2
 3
 4
 5
 6
 7
 8
 9
10
11
|
func alloc2(outCh chan<- int) {
	func() {
		defer fmt.Println("alloc-fm exit")
		// 分配内存,假用一下
		buf := make([]byte, 1024*1024*10)
		_ = len(buf)
		fmt.Println("alloc done")

		outCh <- 0 // 53行
	}()
}
|
阻塞的原因是outCh这个写操作无法完成,outCh是无缓冲的通道,并且由于以下代码是死代码,所以goroutine始终没有从outCh读数据,造成outCh阻塞,进而造成无数个alloc2的goroutine阻塞,形成内存泄露:
1
2
3
|
if false {
    <-outCh
}
|
方式二
url请求中设置debug=2:
1
|
http://ip:port/debug/pprof/goroutine?debug=2
|
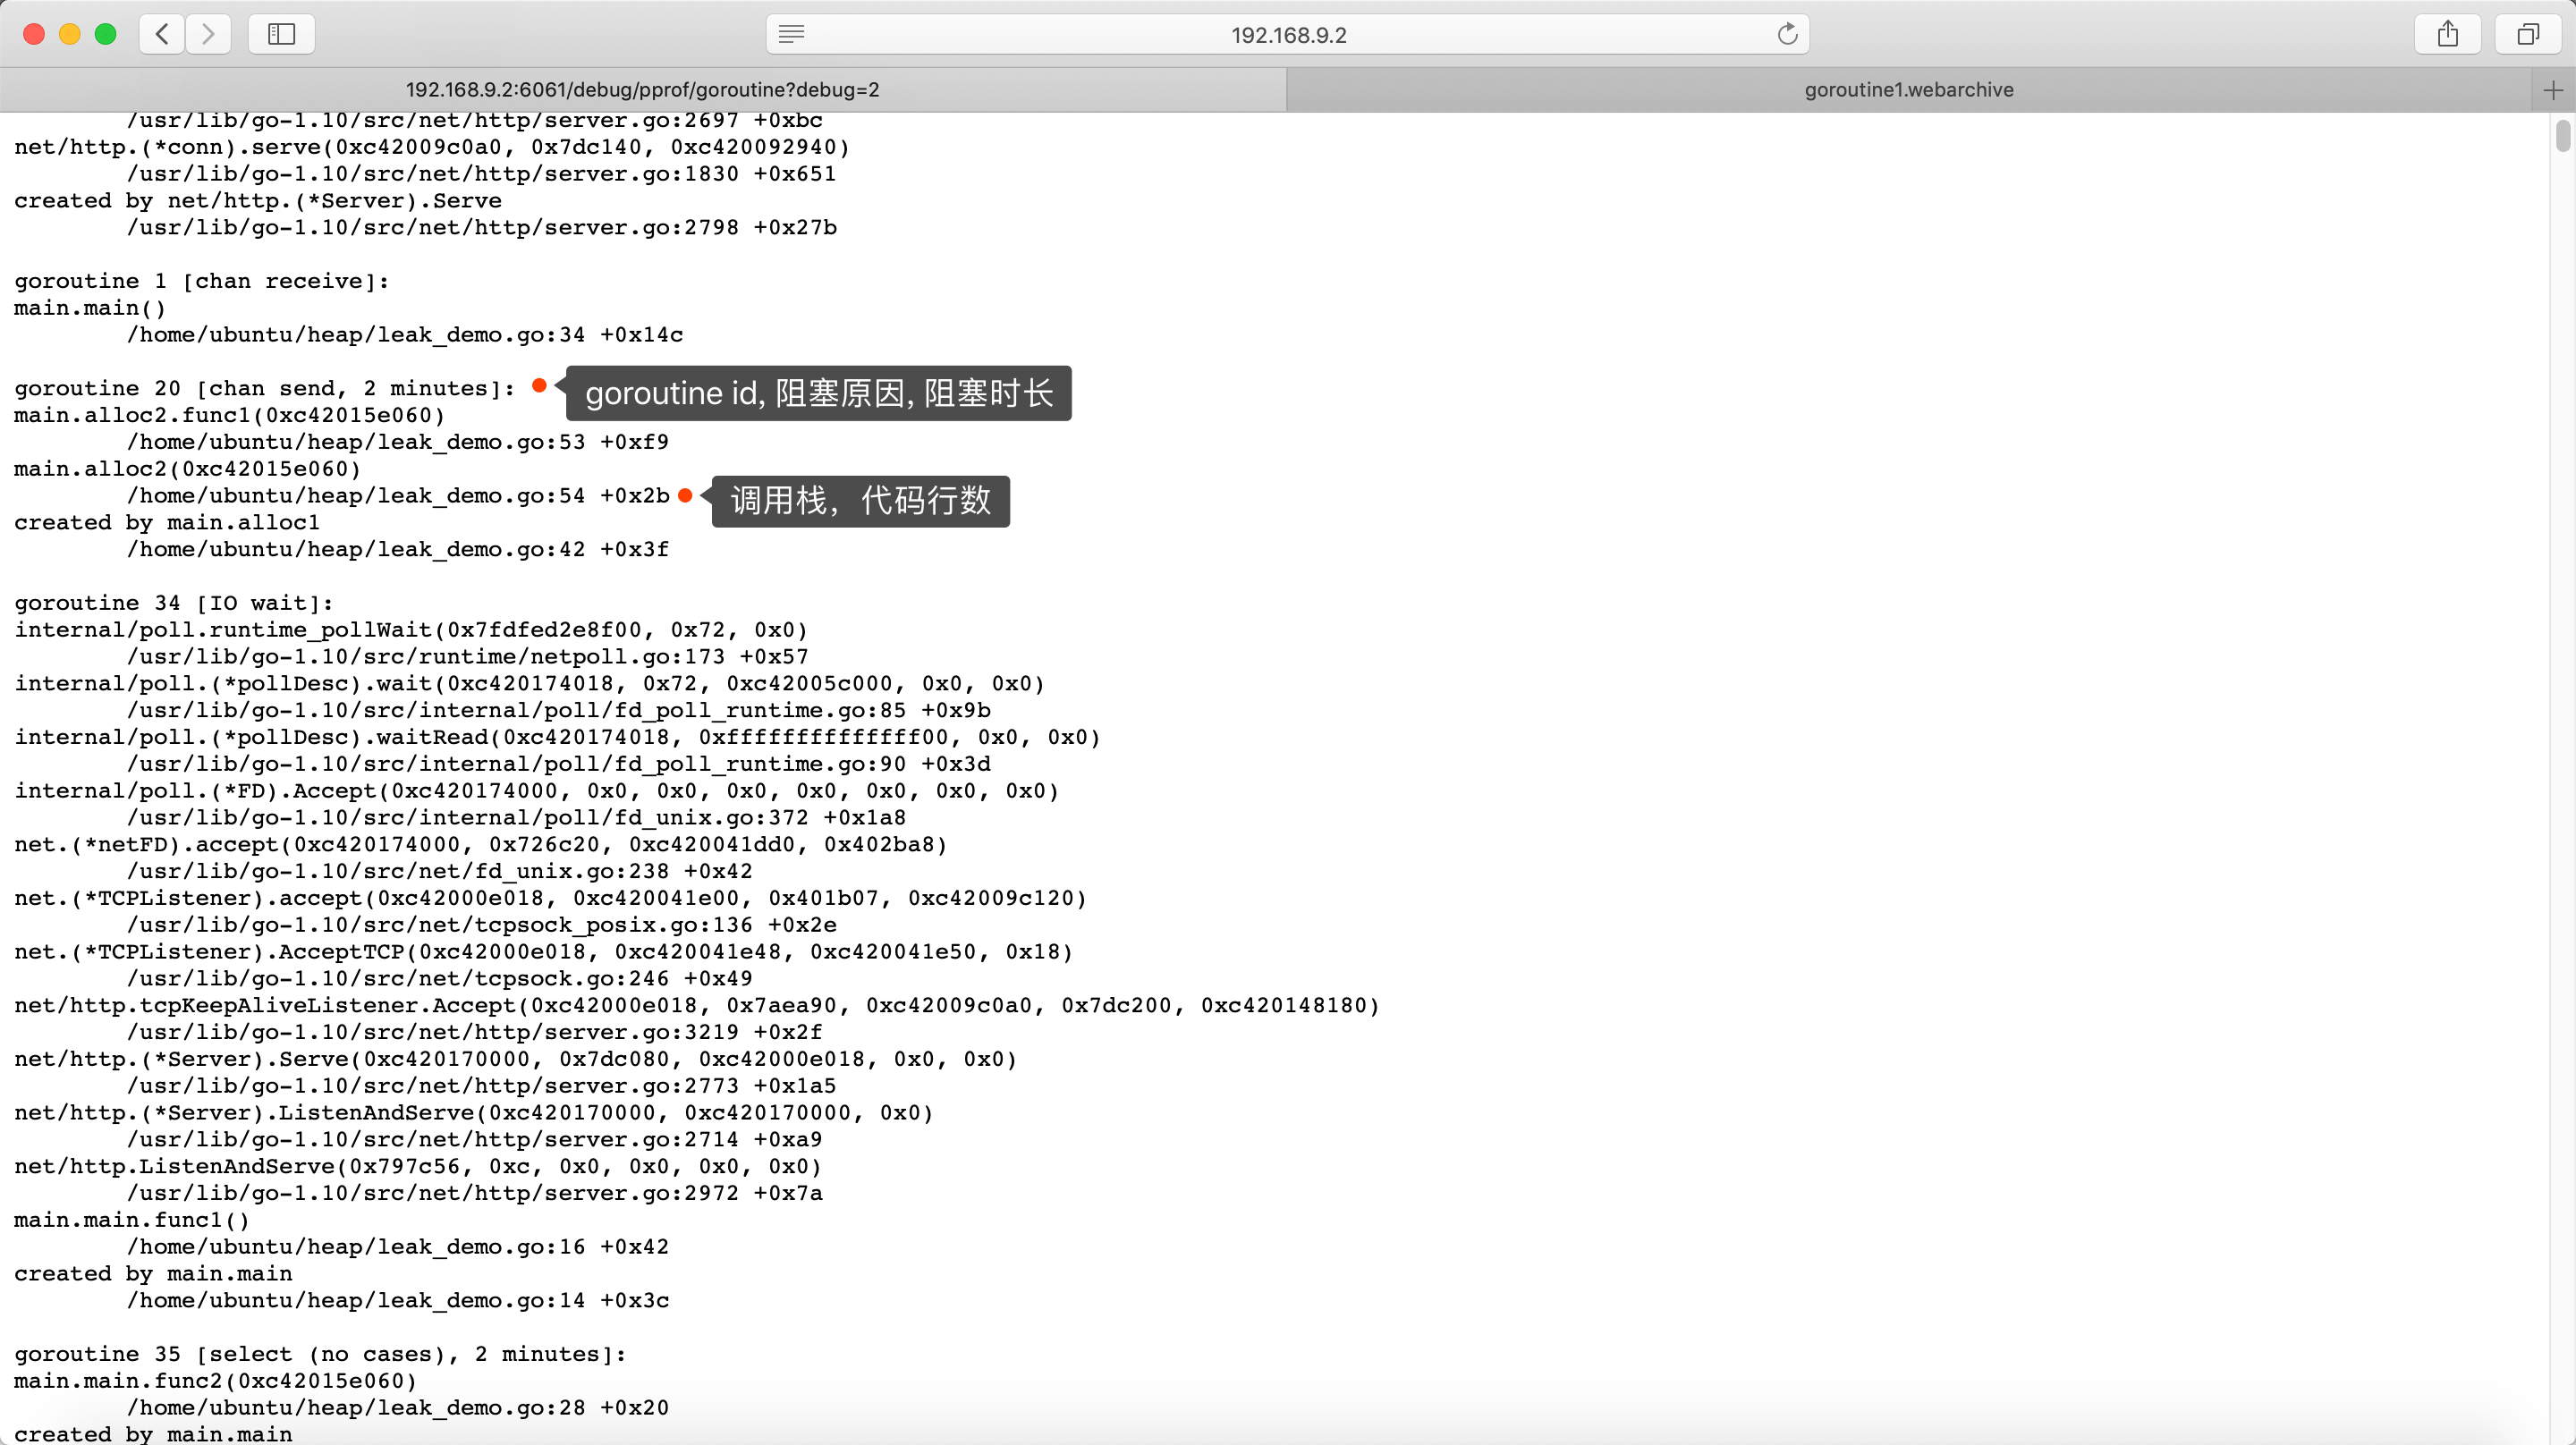
第2种方式和第1种方式是互补的,它可以看到每个goroutine的信息:
- goroutine 20 [chan send, 2 minutes]:20是goroutine id,[]中是当前goroutine的状态,阻塞在写channel,并且阻塞了2分钟,长时间运行的系统,你能看到阻塞时间更长的情况。
- 同时,也可以看到调用栈,看当前执行停到哪了:leak_demo.go的53行,
1
2
3
4
5
6
7
|
goroutine 20 [chan send, 2 minutes]:
main.alloc2.func1(0xc42015e060)
	/home/ubuntu/heap/leak_demo.go:53 +0xf9  // 这
main.alloc2(0xc42015e060)
	/home/ubuntu/heap/leak_demo.go:54 +0x2b
created by main.alloc1
	/home/ubuntu/heap/leak_demo.go:42 +0x3f
|
命令行交互式方法
Web的方法是简单粗暴,无需登录服务器,浏览器打开看看就行了。但就像前面提的,没有浏览器可访问时,命令行交互式才是最佳的方式,并且也是手到擒来,感觉比Web一样方便。
命令行交互式只有1种获取goroutine profile的方法,不像Web网页分debug=1和debug=22中方式,并将profile文件保存到本地:
1
2
3
4
5
6
7
8
9
|
// 注意命令没有`debug=1`,debug=1,加debug有些版本的go不支持
$ go tool pprof http://0.0.0.0:6060/debug/pprof/goroutine
Fetching profile over HTTP from http://localhost:6061/debug/pprof/goroutine
Saved profile in /home/ubuntu/pprof/pprof.leak_demo.goroutine.001.pb.gz  // profile文件保存位置
File: leak_demo
Type: goroutine
Time: May 16, 2019 at 2:44pm (CST)
Entering interactive mode (type "help" for commands, "o" for options)
(pprof)
|
命令行只需要掌握3个命令就好:
- top:显示正运行到某个函数goroutine的数量
- traces:显示所有goroutine的调用栈
- list:列出代码详细的信息。
我们依然使用这个demo:
 1
 2
 3
 4
 5
 6
 7
 8
 9
10
11
12
13
14
15
16
17
18
19
20
21
22
23
24
25
26
27
28
29
30
31
32
33
34
35
36
37
38
39
40
41
42
43
44
45
46
47
48
49
50
51
52
53
54
55
|
// goroutine泄露导致内存泄露
package main

import (
	"fmt"
	"net/http"
	_ "net/http/pprof"
	"os"
	"time"
)

func main() {
	// 开启pprof
	go func() {
		ip := "0.0.0.0:6060"
		if err := http.ListenAndServe(ip, nil); err != nil {
			fmt.Printf("start pprof failed on %s\n", ip)
			os.Exit(1)
		}
	}()

	outCh := make(chan int)
	// 死代码,永不读取
	go func() {
		if false {
			<-outCh
		}
		select {}
	}()

	// 每s起100个goroutine,goroutine会阻塞,不释放内存
	tick := time.Tick(time.Second / 100)
	i := 0
	for range tick {
		i++
		fmt.Println(i)
		alloc1(outCh)
	}
}

func alloc1(outCh chan<- int) {
	go alloc2(outCh)
}

func alloc2(outCh chan<- int) {
	func() {
		defer fmt.Println("alloc-fm exit")
		// 分配内存,假用一下
		buf := make([]byte, 1024*1024*10)
		_ = len(buf)
		fmt.Println("alloc done")

		outCh <- 0 // 53行
	}()
}
|
 1
 2
 3
 4
 5
 6
 7
 8
 9
10
11
12
13
14
15
16
17
18
19
20
21
22
23
24
25
26
27
28
29
|
$  go tool pprof -base pprof.leak_demo.goroutine.001.pb.gz pprof.leak_demo.goroutine.002.pb.gz
File: leak_demo
Type: goroutine
Time: May 16, 2019 at 2:44pm (CST)
Entering interactive mode (type "help" for commands, "o" for options)
(pprof)
(pprof)
(pprof) top
Showing nodes accounting for 20312, 100% of 20312 total
      flat  flat%   sum%        cum   cum%
     20312   100%   100%      20312   100%  runtime.gopark
         0     0%   100%      20312   100%  main.alloc2
         0     0%   100%      20312   100%  main.alloc2.func1
         0     0%   100%      20312   100%  runtime.chansend
         0     0%   100%      20312   100%  runtime.chansend1
         0     0%   100%      20312   100%  runtime.goparkunlock
(pprof)
(pprof) traces
File: leak_demo
Type: goroutine
Time: May 16, 2019 at 2:44pm (CST)
-----------+-------------------------------------------------------
     20312   runtime.gopark
             runtime.goparkunlock
             runtime.chansend
             runtime.chansend1 // channel发送
             main.alloc2.func1 // alloc2中的匿名函数
             main.alloc2
-----------+-------------------------------------------------------
|
top命令在怎么确定是goroutine泄露引发的内存泄露介绍过了,直接看traces命令,traces能列出002中比001中多的那些goroutine的调用栈,这里只有1个调用栈,有20312个goroutine都执行这个调用路径,可以看到alloc2中的匿名函数alloc2.func1调用了写channel的操作,然后阻塞挂起了goroutine,使用list列出alloc2.func1的代码,显示有20312个goroutine阻塞在53行:
 1
 2
 3
 4
 5
 6
 7
 8
 9
10
11
12
13
|
(pprof) list main.alloc2.func1
Total: 20312
ROUTINE ======================== main.alloc2.func1 in /home/ubuntu/heap/leak_demo.go
         0      20312 (flat, cum)   100% of Total
         .          .     48:		// 分配内存,假用一下
         .          .     49:		buf := make([]byte, 1024*1024*10)
         .          .     50:		_ = len(buf)
         .          .     51:		fmt.Println("alloc done")
         .          .     52:
         .      20312     53:		outCh <- 0  // 看这
         .          .     54:	}()
         .          .     55:}
         .          .     56:
|
友情提醒:使用list命令的前提是程序的源码在当前机器,不然可没法列出源码。服务器上,通常没有源码,那我们咋办呢?刚才介绍了Web查看的方式,那里会列出代码行数,我们可以使用wget下载网页:
1
|
wget http://localhost:6060/debug/pprof/goroutine?debug=1
|
下载网页后,使用编辑器打开文件,使用关键字main.alloc2.func1进行搜索,找到与当前相同的调用栈,就可以看到该goroutine阻塞在哪一行了,不要忘记使用debug=2还可以看到阻塞了多久和原因.
总结
goroutine泄露的本质
goroutine泄露的本质是channel阻塞,无法继续向下执行,导致此goroutine关联的内存都无法释放,进一步造成内存泄露。
goroutine泄露的发现和定位
利用好go pprof获取goroutine profile文件,然后利用3个命令top、traces、list定位内存泄露的原因。
goroutine泄露的场景
泄露的场景不仅限于以下两类,但因channel相关的泄露是最多的。
- channel的读或者写:
- 无缓冲channel的阻塞通常是写操作因为没有读而阻塞
- 有缓冲的channel因为缓冲区满了,写操作阻塞
- 期待从channel读数据,结果没有goroutine写
- select操作,select里也是channel操作,如果所有case上的操作阻塞,goroutine也无法继续执行。
编码goroutine泄露的建议
为避免goroutine泄露造成内存泄露,启动goroutine前要思考清楚:
- goroutine如何退出?
- 是否会有阻塞造成无法退出?如果有,那么这个路径是否会创建大量的goroutine?
转载:http://lessisbetter.site/2019/05/18/go-goroutine-leak/