示例代码
我们写一个程序来计算单词数量:
 1
 2
 3
 4
 5
 6
 7
 8
 9
10
11
12
13
14
15
16
17
18
19
20
21
22
23
24
25
26
27
28
29
30
31
32
33
34
35
36
37
38
39
40
|
package main

import (
        "fmt"
        "io"
        "log"
        "os"
        "unicode"
)

func readbyte(r io.Reader) (rune, error) {
        var buf [1]byte
        _, err := r.Read(buf[:])
        return rune(buf[0]), err
}

func main() {
        f, err := os.Open(os.Args[1])
        if err != nil {
                log.Fatalf("could not open file %q: %v", os.Args[1], err)
        }

        words := 0
        inword := false
        for {
                r, err := readbyte(f)
                if err == io.EOF {
                        break
                }
                if err != nil {
                        log.Fatalf("could not read file %q: %v", os.Args[1], err)
                }
                if unicode.IsSpace(r) && inword {
                        words++
                        inword = false
                }
                inword = unicode.IsLetter(r)
        }
        fmt.Printf("%q: %d words\n", os.Args[1], words)
}
|
让我们看看赫尔曼·梅尔维尔的经典[《白鲸记》][6] (源自古腾堡计划)中有多少单词。
1
2
3
4
5
6
|
% time go run main.go moby.txt
"moby.txt": 181275 words

real    0m2.110s
user    0m1.264s
sys     0m0.944s
|
来和 unix 系统的 wc -w 做一个比较
1
2
3
4
5
6
|
% time wc -w  moby.txt
  215829 moby.txt

real    0m0.012s
user    0m0.009s
sys     0m0.002s
|
结果不一样。wc 给出的字数高出 19% 左右,因为它计算一个词的规则与我的例子不同。这并不重要——两个程序都将整个文件作为输入,并在一次传递中计算从单词到非单词的转换次数。
让我们使用 pprof 调查这些程序为何具有不同的运行时间。
加入 CPU 分析
首先,编辑 main.go 并开启 profile
1
2
3
4
5
6
7
|
        ...
        "github.com/pkg/profile"
)

func main() {
        defer profile.Start().Stop()
        ...
|
现在,当我们的程序运行起来时,会创建一个cpu.pprof 文件
1
2
3
4
|
% go run main.go moby.txt
2018/08/25 14:09:01 profile: cpu profiling enabled, /var/folders/by/3gf34_z95zg05cyj744_vhx40000gn/T/profile239941020/cpu.pprof
"moby.txt": 181275 words
2018/08/25 14:09:03 profile: cpu profiling disabled, /var/folders/by/3gf34_z95zg05cyj744_vhx40000gn/T/profile239941020/cpu.pprof
|
现在我们可用 go tool pprof来分析它
 1
 2
 3
 4
 5
 6
 7
 8
 9
10
11
12
13
14
15
16
17
|
% go tool pprof /var/folders/by/3gf34_z95zg05cyj744_vhx40000gn/T/profile239941020/cpu.pprof
Type: cpu
Time: Aug 25, 2018 at 2:09pm (AEST)
Duration: 2.05s, Total samples = 1.36s (66.29%)
Entering interactive mode (type "help" for commands, "o" for options)
(pprof) top
Showing nodes accounting for 1.42s, 100% of 1.42s total
      flat  flat%   sum%        cum   cum%
     1.41s 99.30% 99.30%      1.41s 99.30%  syscall.Syscall
     0.01s   0.7%   100%      1.42s   100%  main.readbyte
         0     0%   100%      1.41s 99.30%  internal/poll.(*FD).Read
         0     0%   100%      1.42s   100%  main.main
         0     0%   100%      1.41s 99.30%  os.(*File).Read
         0     0%   100%      1.41s 99.30%  os.(*File).read
         0     0%   100%      1.42s   100%  runtime.main
         0     0%   100%      1.41s 99.30%  syscall.Read
         0     0%   100%      1.41s 99.30%  syscall.read
|
top 命令从降序展示了函数的调用时间。 我们可以看到在 syscall.Syscall上花费了 99% 的时间, 和 main.readbyte花费了很少的一部分。
我们还可以使用web命令可视化这个调用。这将从 profile 数据生成有向图。它实际使用来自 Graphviz 的dot命令。
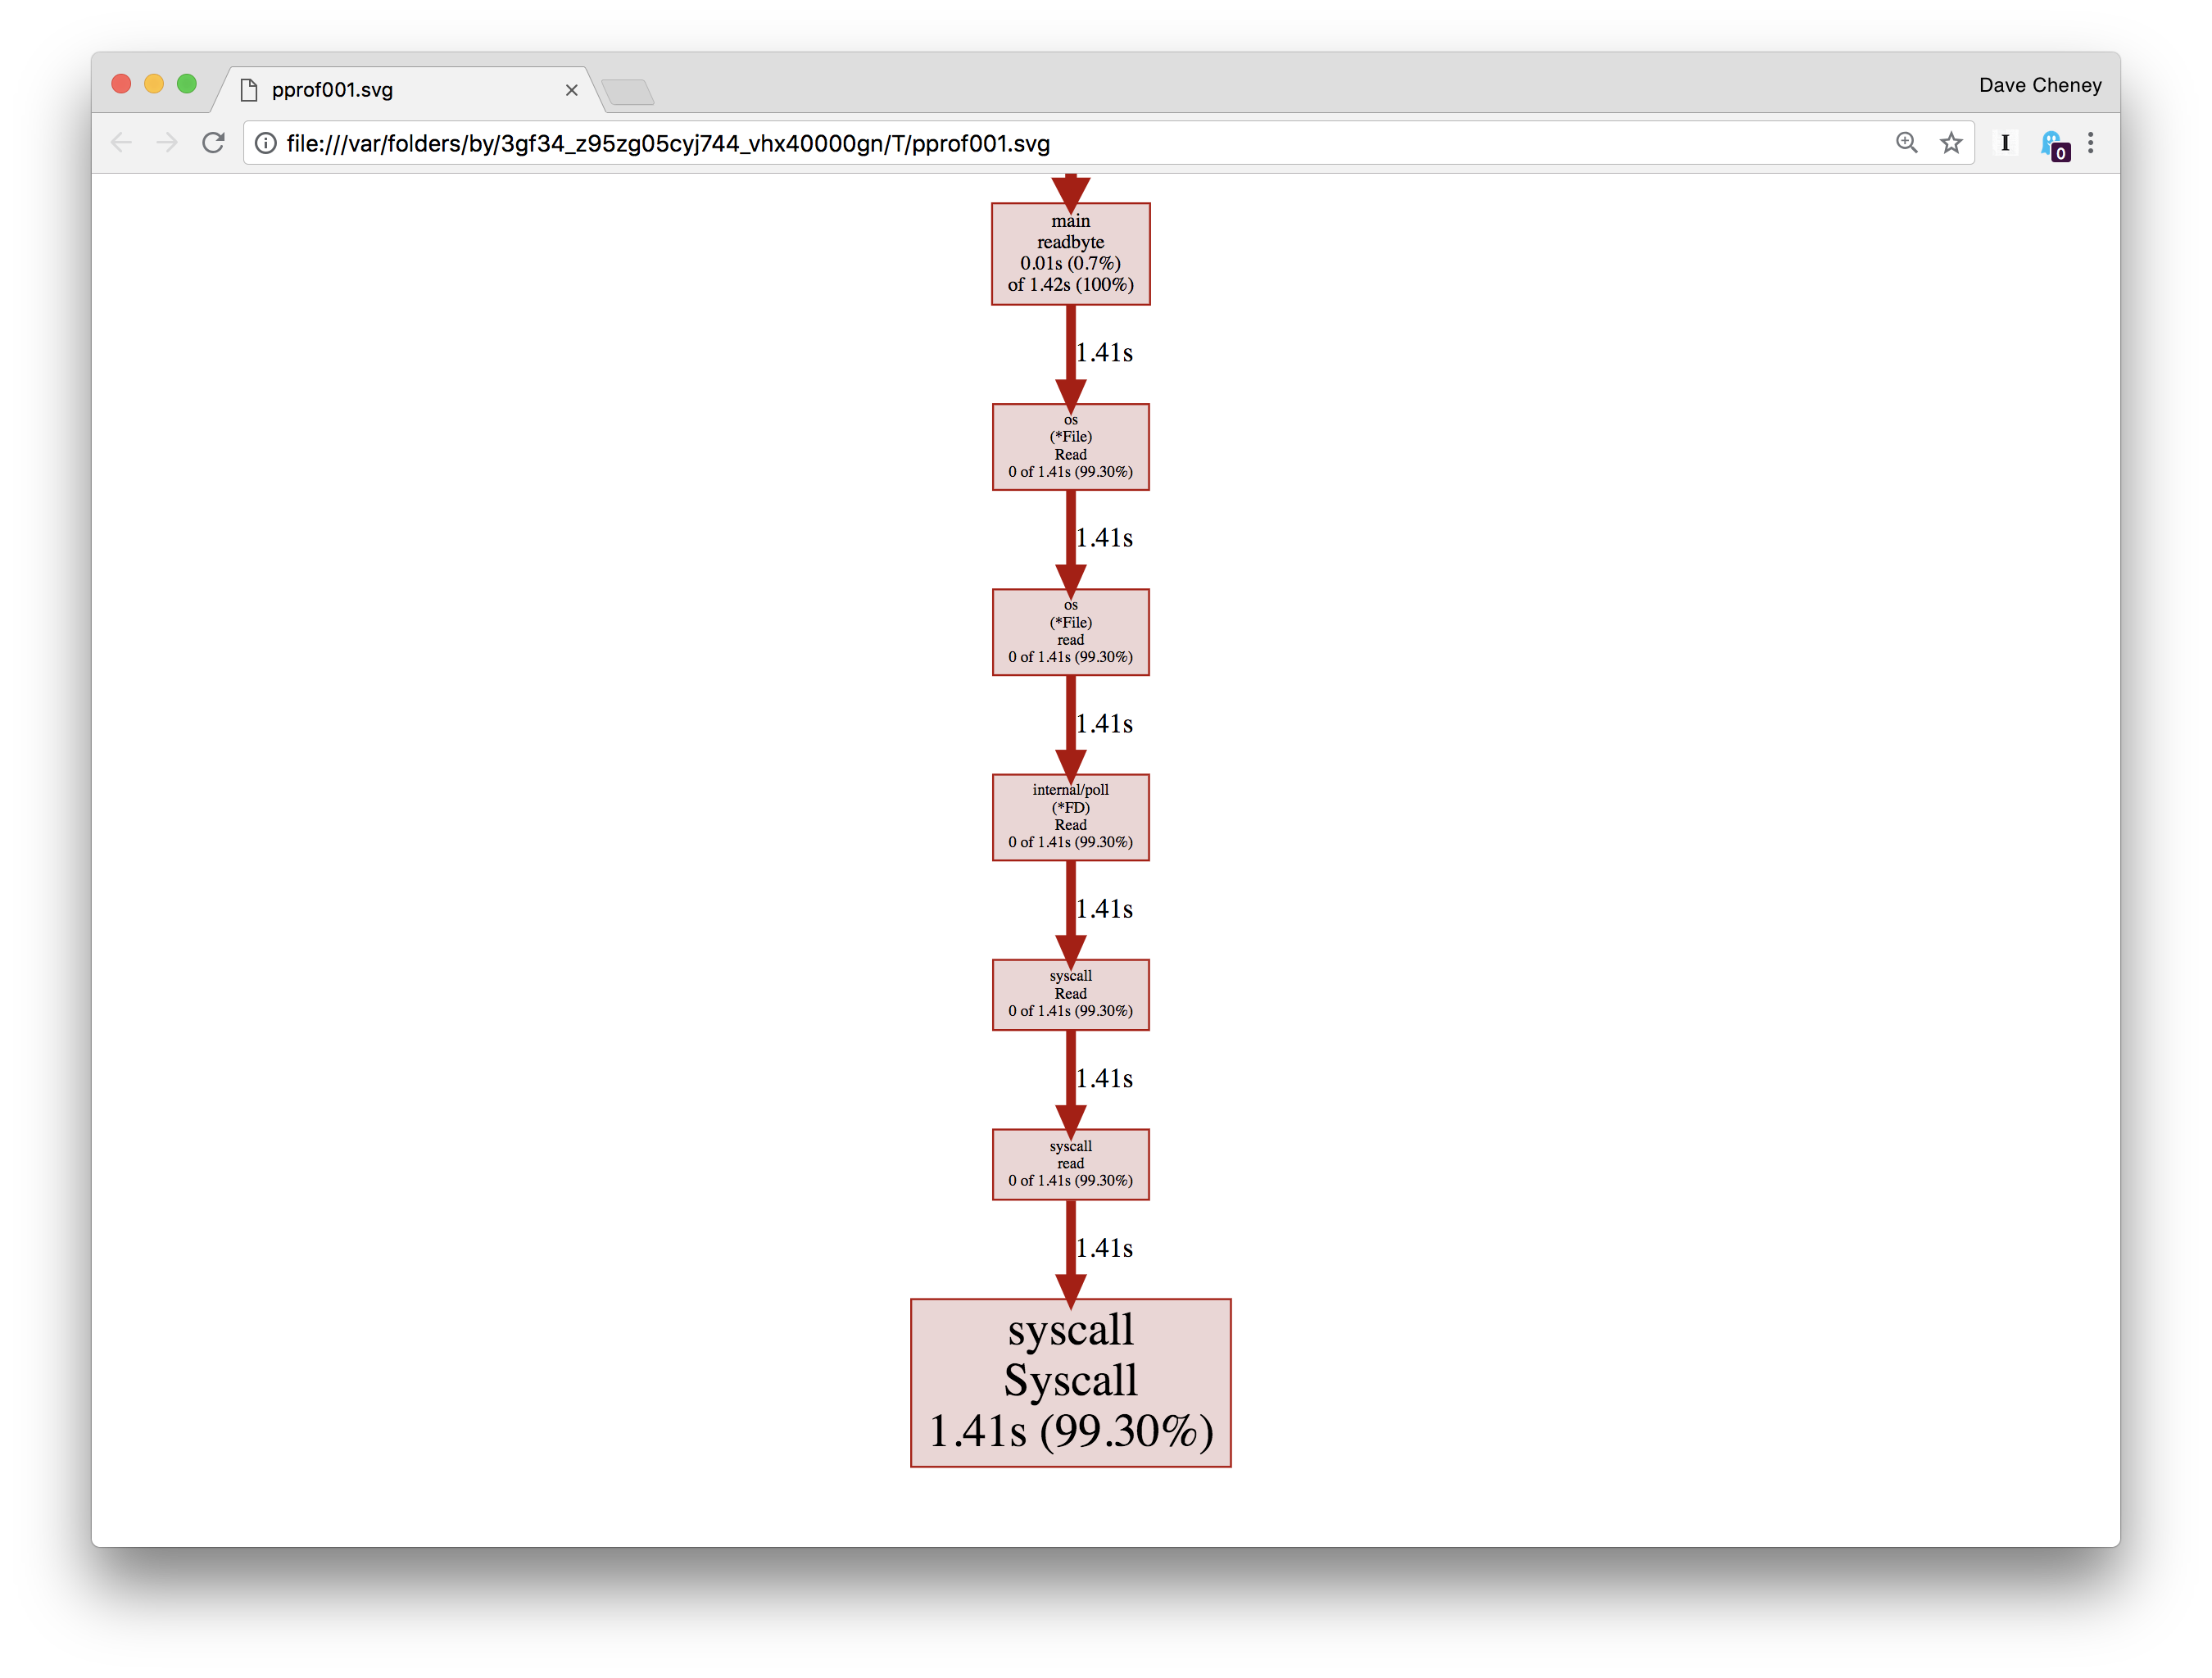
在图中,消耗 CPU 时间最多的盒子是最大的 – 我们看到的sys call.Syscall 占用了总程序运行时间的 99.3%。通往syscall.Syscall的一串盒子代表它的直接调用者 – 如果多个路径收敛于同一个函数,则表示有多个调用者。箭头旁边的数字表示运行所花费的时间。我们从 main.readbyte 开始看,一直到最后,占用都接近0。
改进我们的版本
我们程序跑慢不是因为 Go 的 syscall.Syscall 。因为系统调用本来就慢。
每次调用readbyte都会产生一个缓冲区大小为1的syscall.Read。因此,我们程序执行的系统调用数等于输入的大小。在 pprof 图中我们可以看到,读取输入决定了其他一切。
 1
 2
 3
 4
 5
 6
 7
 8
 9
10
11
12
13
14
15
16
17
18
19
20
21
22
23
24
25
|
func main() {
        f, err := os.Open(os.Args[1])
        if err != nil {
                log.Fatalf("could not open file %q: %v", os.Args[1], err)
        }

        b := bufio.NewReader(f)
        words := 0
        inword := false
        for {
                r, err := readbyte(b)
                if err == io.EOF {
                        break
                }
                if err != nil {
                        log.Fatalf("could not read file %q: %v", os.Args[1], err)
                }
                if unicode.IsSpace(r) && inword {
                        words++
                        inword = false
                }
                inword = unicode.IsLetter(r)
        }
        fmt.Printf("%q: %d words\n", os.Args[1], words)
}
|
这样我们可以通过在输入文件和readbyte 之间插入bufio.Reader来提升性能。
内存分析
profile 还告诉了我们,readbyte 函数内部分配了一些东西。我们可以使用 pprof 进行研究。
1
|
defer profile.Start(profile.MemProfile).Stop()
|
然后正常运行程序
1
2
3
4
|
% go run main2.go moby.txt
2018/08/25 14:41:15 profile: memory profiling enabled (rate 4096), /var/folders/by/3gf34_z95zg05cyj744_vhx40000gn/T/profile312088211/mem.pprof
"moby.txt": 181275 words
2018/08/25 14:41:15 profile: memory profiling disabled, /var/folders/by/3gf34_z95zg05cyj744_vhx40000gn/T/profile312088211/mem.pprof
|
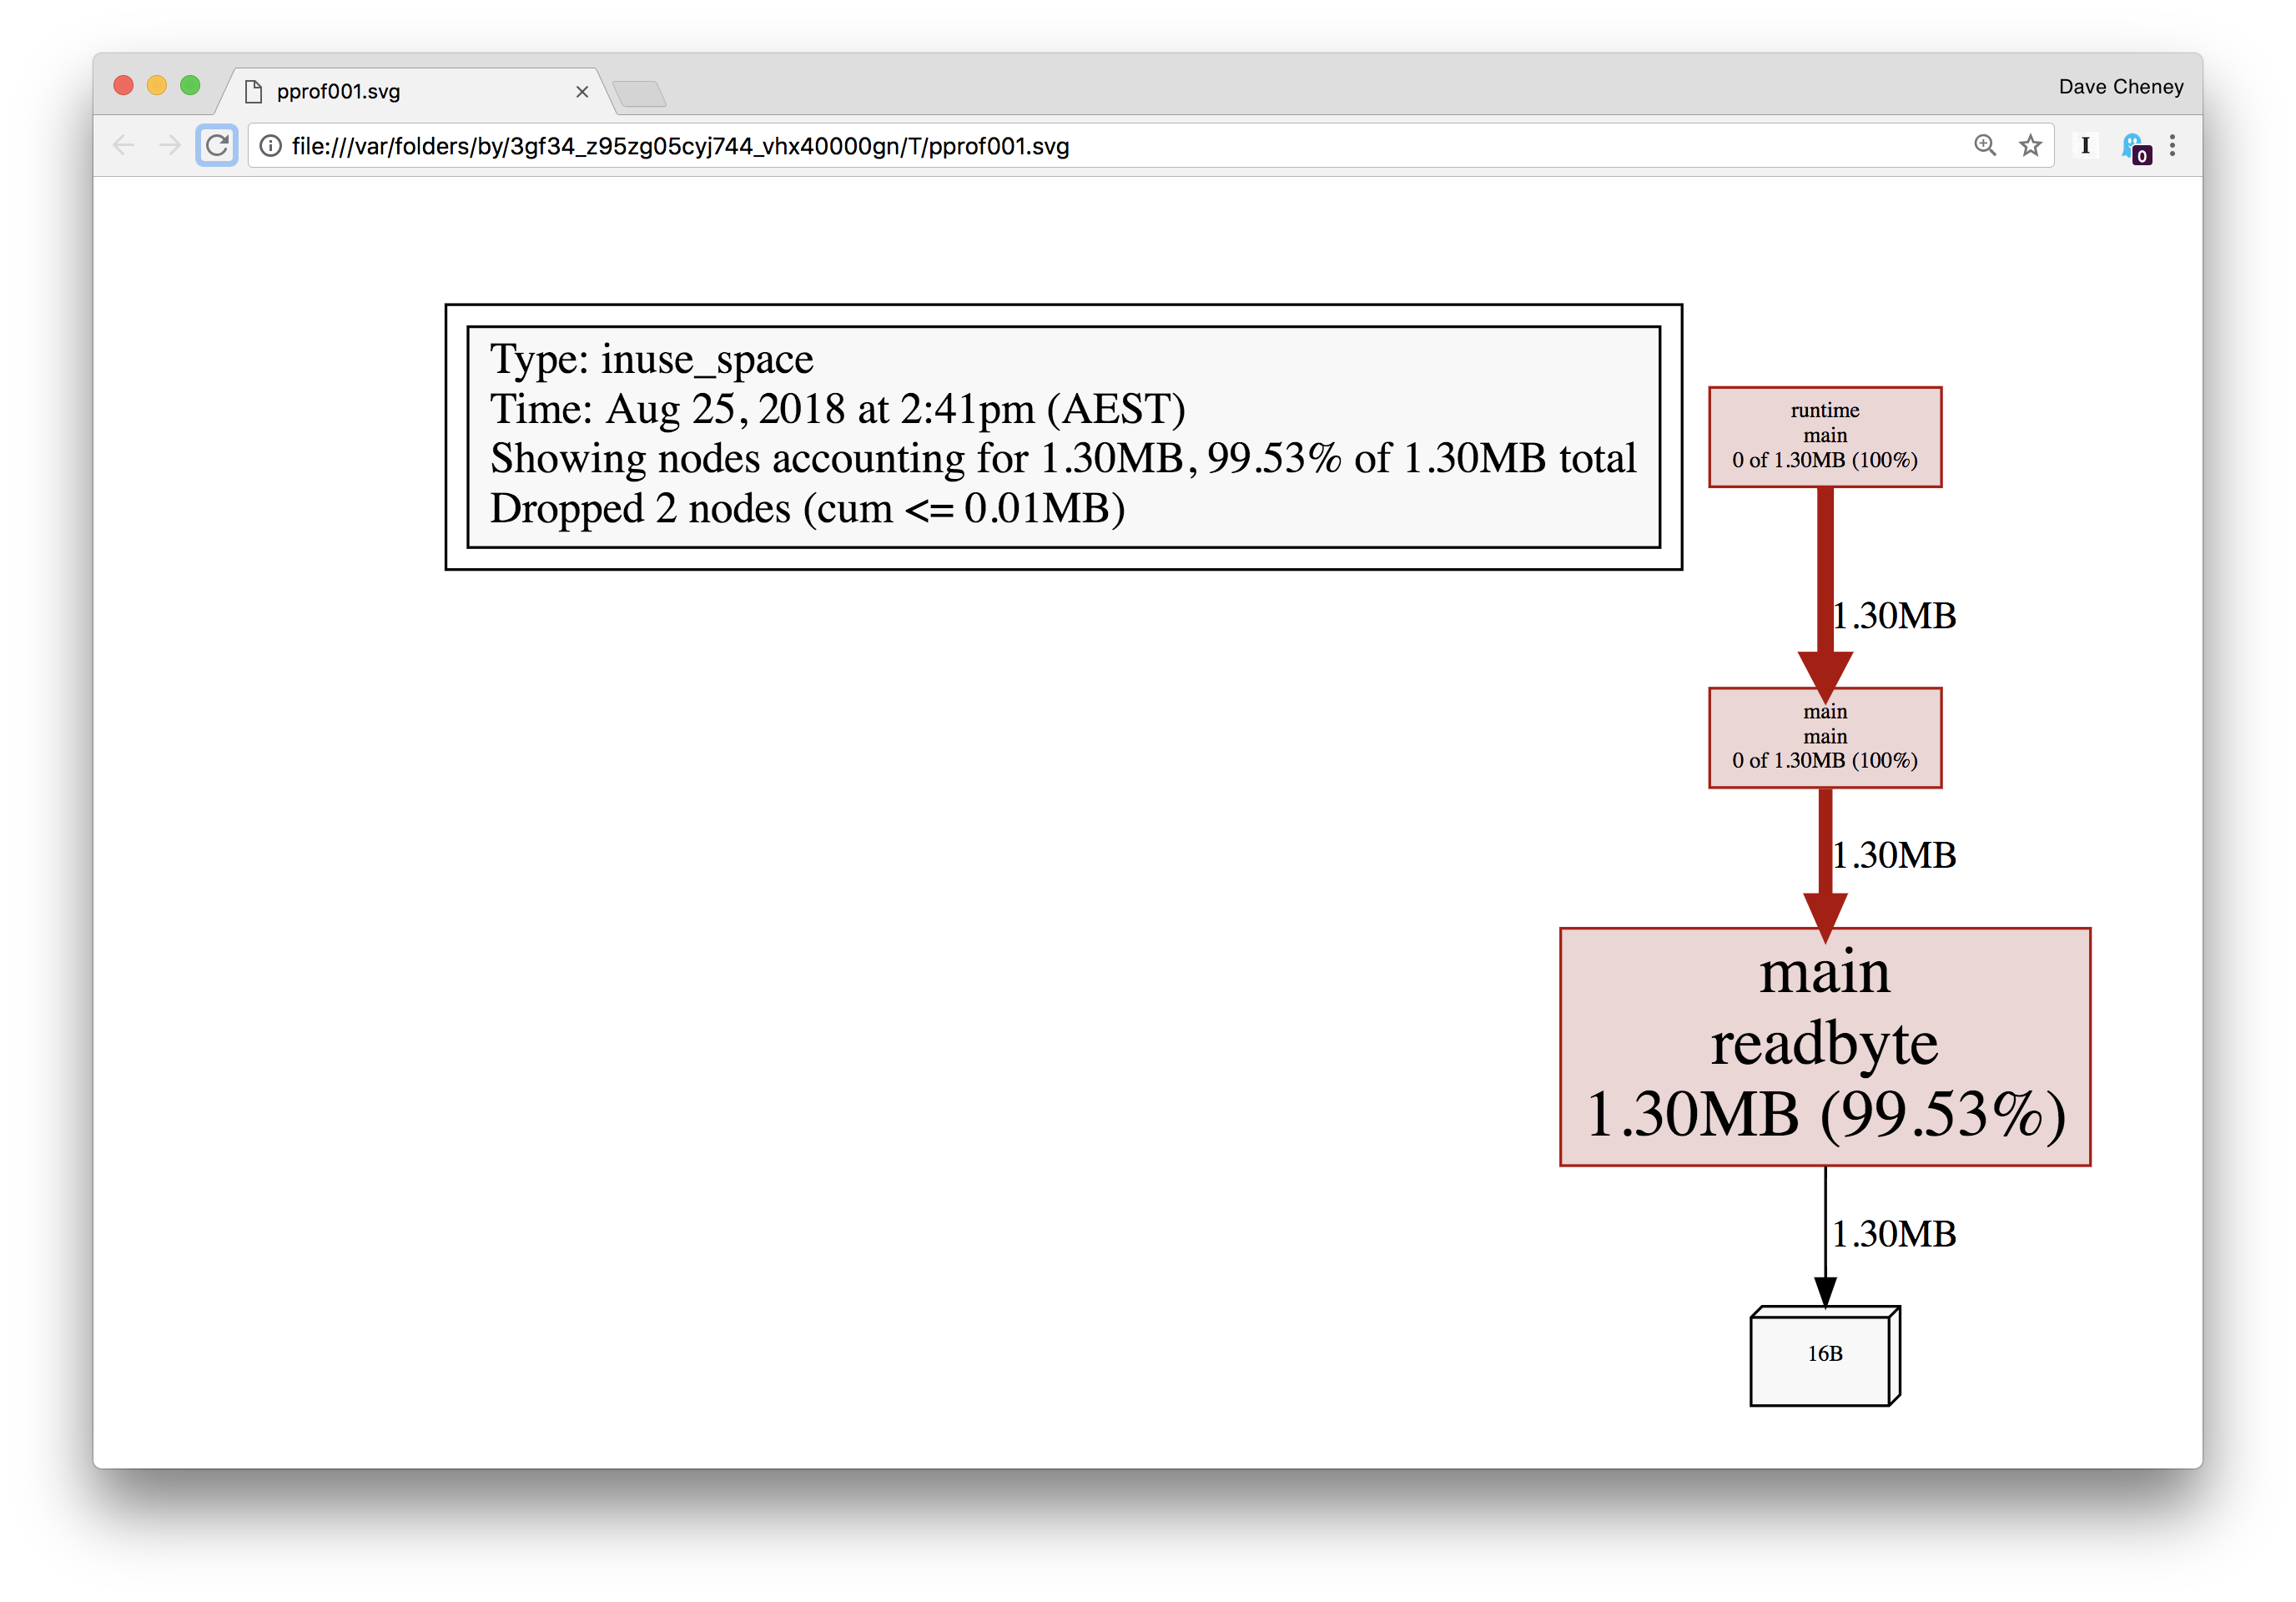
正如我们所怀疑的那样,分配来自 readbyte – 这并不复杂,只有三行代码:
1
2
3
4
5
|
func readbyte(r io.Reader) (rune, error) {
        var buf [1]byte // allocation is here
        _, err := r.Read(buf[:])
        return rune(buf[0]), err
}
|
我们将在下一节详细讨论为什么会发生这种情况,但目前我们看到的是,每个对readbyte的调用都在分配一个新的1字节长的数组,而这个数组正在堆上分配。
分配对象 vs. 使用中的对象
内存分析有两种选择,以 go tool pprof 工具的标识命名:
-alloc_objects 报告每次分配时的所在的地方-inuse_objects 报告被使用的地方,可以在 profile 文件的末尾找到
为了说明这一点,这里有一个设计好的程序,它将以一种受控的方式分配一些内存。
 1
 2
 3
 4
 5
 6
 7
 8
 9
10
11
12
13
14
15
16
17
18
19
20
21
22
|
// ensure y is live beyond the end of main.
var y []byte

func main() {
        defer profile.Start(profile.MemProfile, profile.MemProfileRate(1)).Stop()
        y = allocate(100000)
        runtime.GC()
}

// allocate allocates count byte slices and returns the first slice allocated.
func allocate(count int) []byte {
        var x [][]byte
        for i := 0; i < count; i++ {
                x = append(x, makeByteSlice())
        }
        return x[0]
}

// makeByteSlice returns a byte slice of a random length in the range [0, 16384).
func makeByteSlice() []byte {
        return make([]byte, rand.Intn(1<<14))
}
|
该程序使用 profile 包进行标注,我们将内存采集速率设置为1——也就是说,每个分配都记录堆栈跟踪。这大大降低了程序的速度,但你很快就会明白为什么。
1
2
3
|
% go run main.go
2018/08/25 15:22:05 profile: memory profiling enabled (rate 1), /var/folders/by/3gf34_z95zg05cyj744_vhx40000gn/T/profile730812803/mem.pprof
2018/08/25 15:22:05 profile: memory profiling disabled, /var/folders/by/3gf34_z95zg05cyj744_vhx40000gn/T/profile730812803/mem.pprof
|
让我们看一下分配对象的图,这是默认值,并显示了导致 profile 文件中每个对象分配的调用图。
1
|
% go tool pprof -web -alloc_objects /var/folders/by/3gf34_z95zg05cyj744_vhx40000gn/T/profile891268605/mem.pprof
|
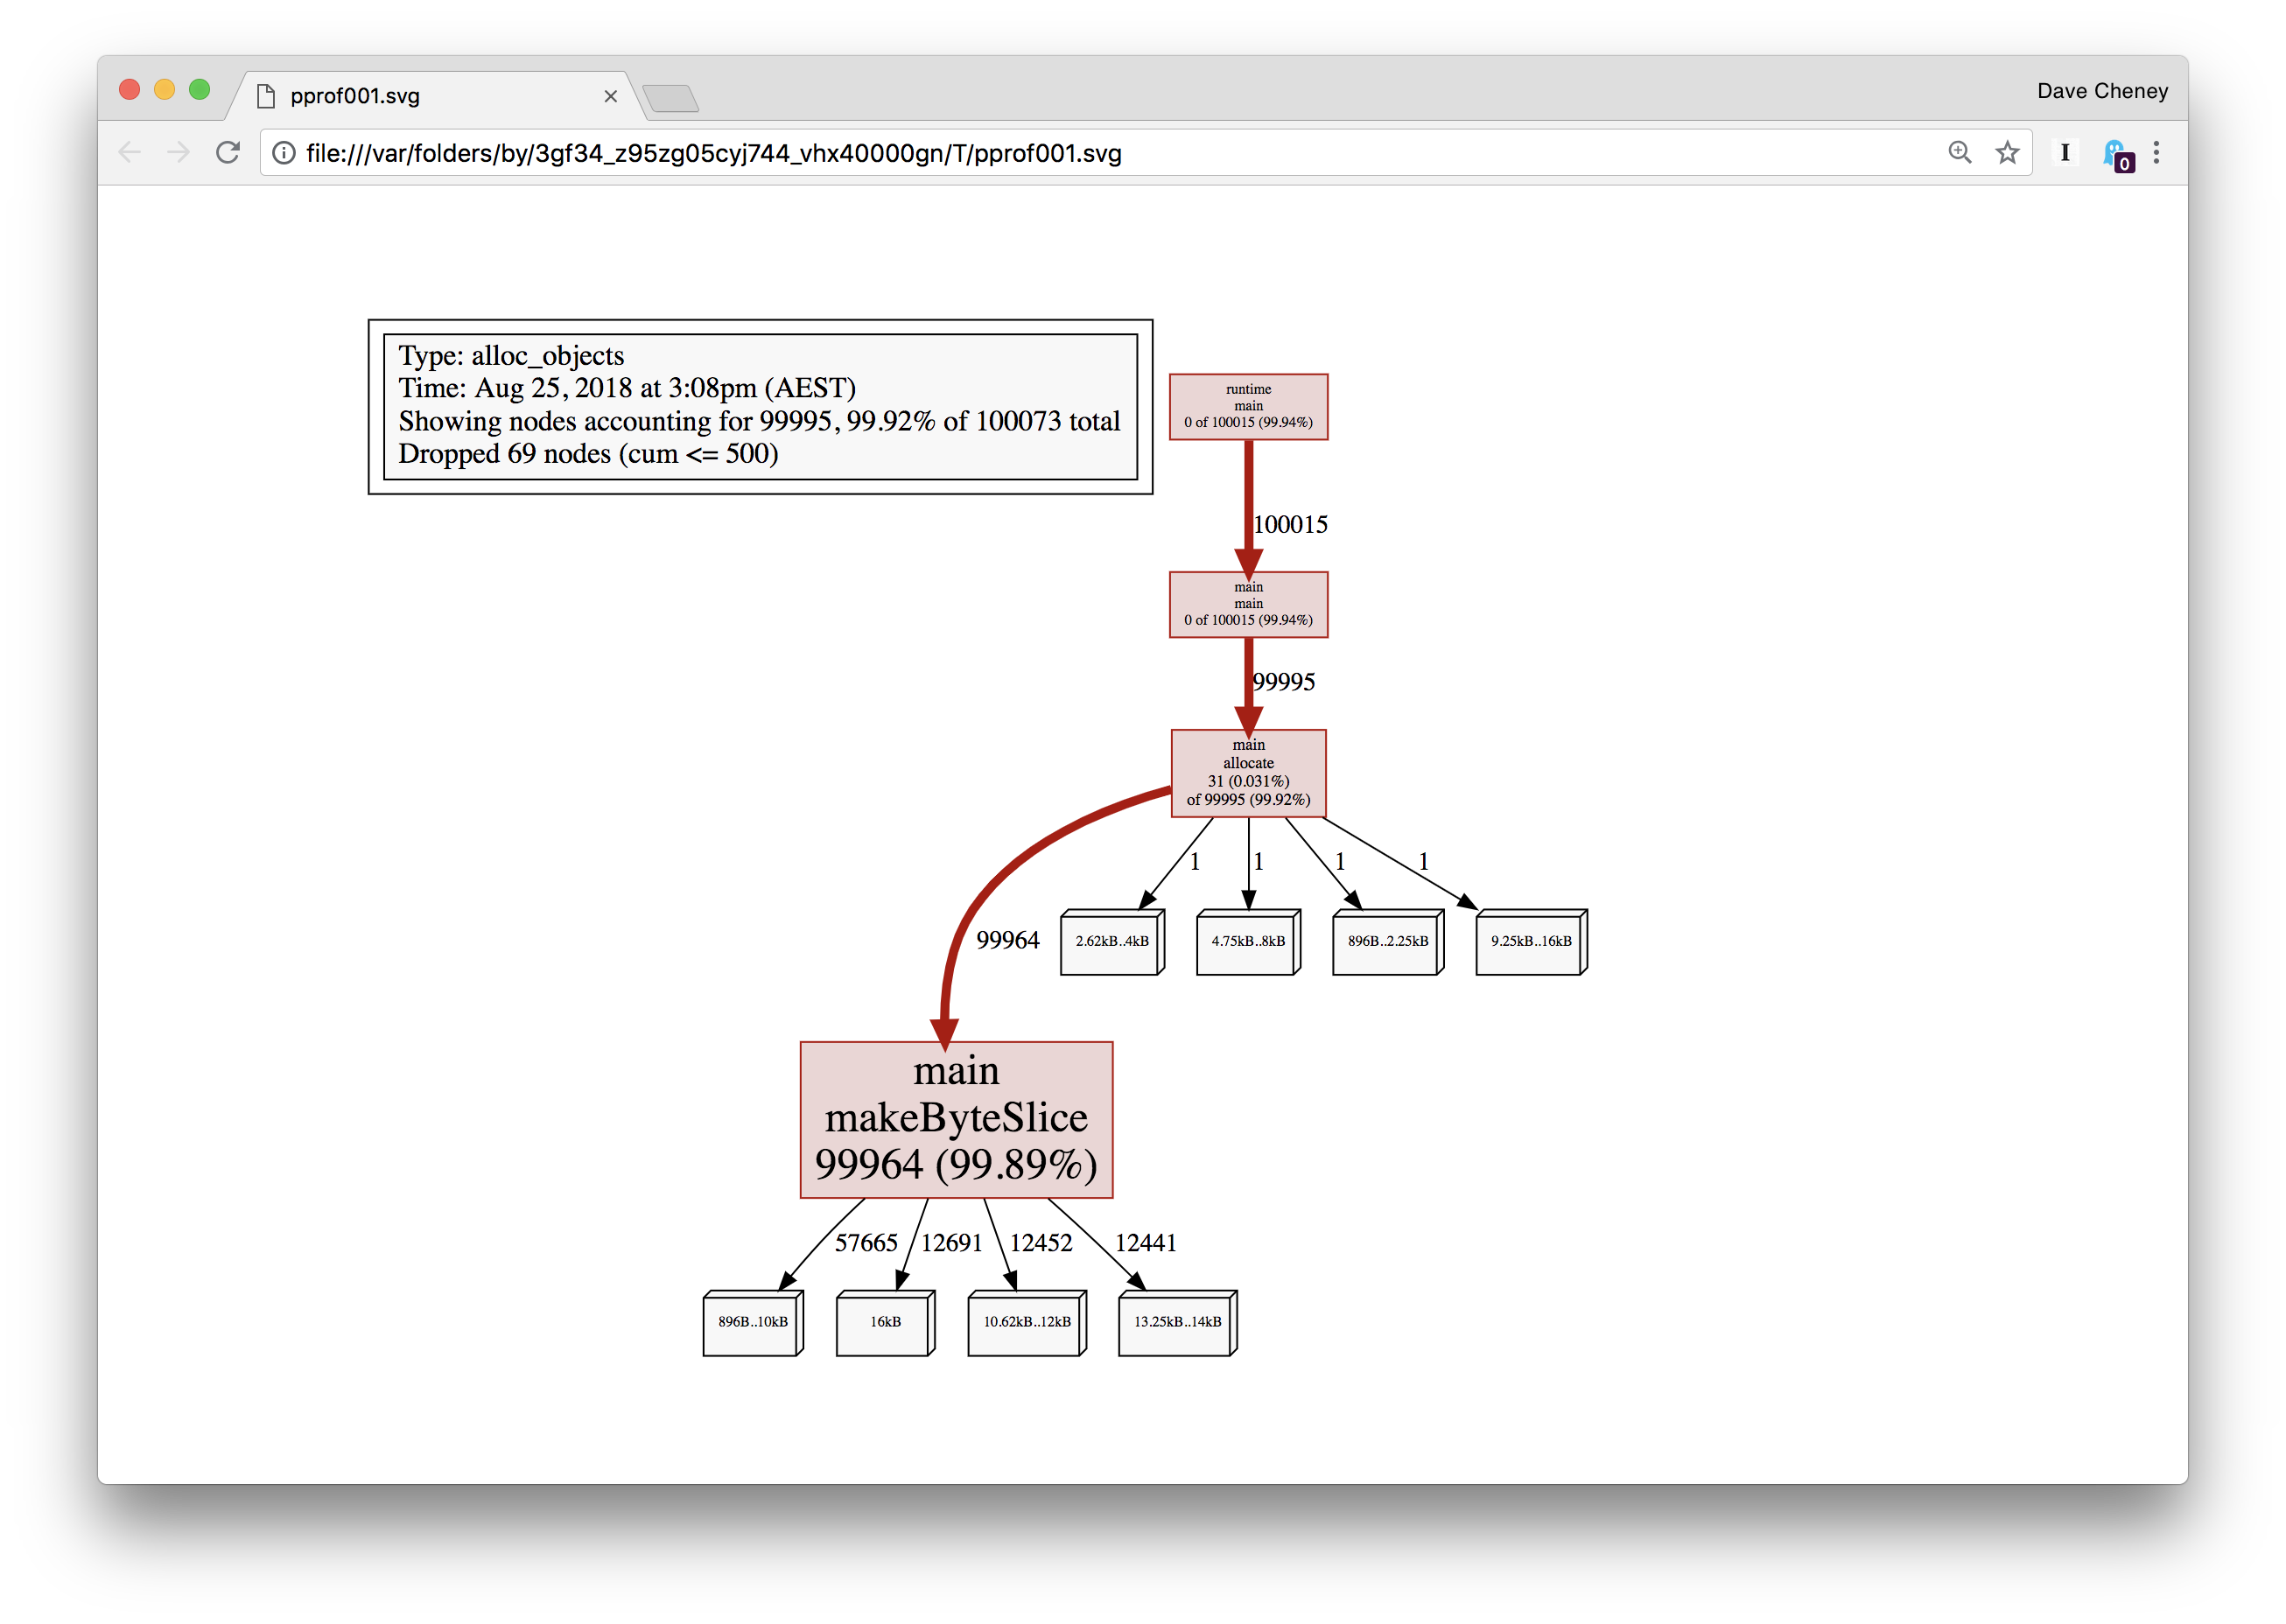
不足为奇的是超过 99% 的分配都是在 makeByteSlice内部进行的。现在让我们 换用-inuse_objects查看 profile
1
|
% go tool pprof -web -inuse_objects /var/folders/by/3gf34_z95zg05cyj744_vhx40000gn/T/profile891268605/mem.pprof
|
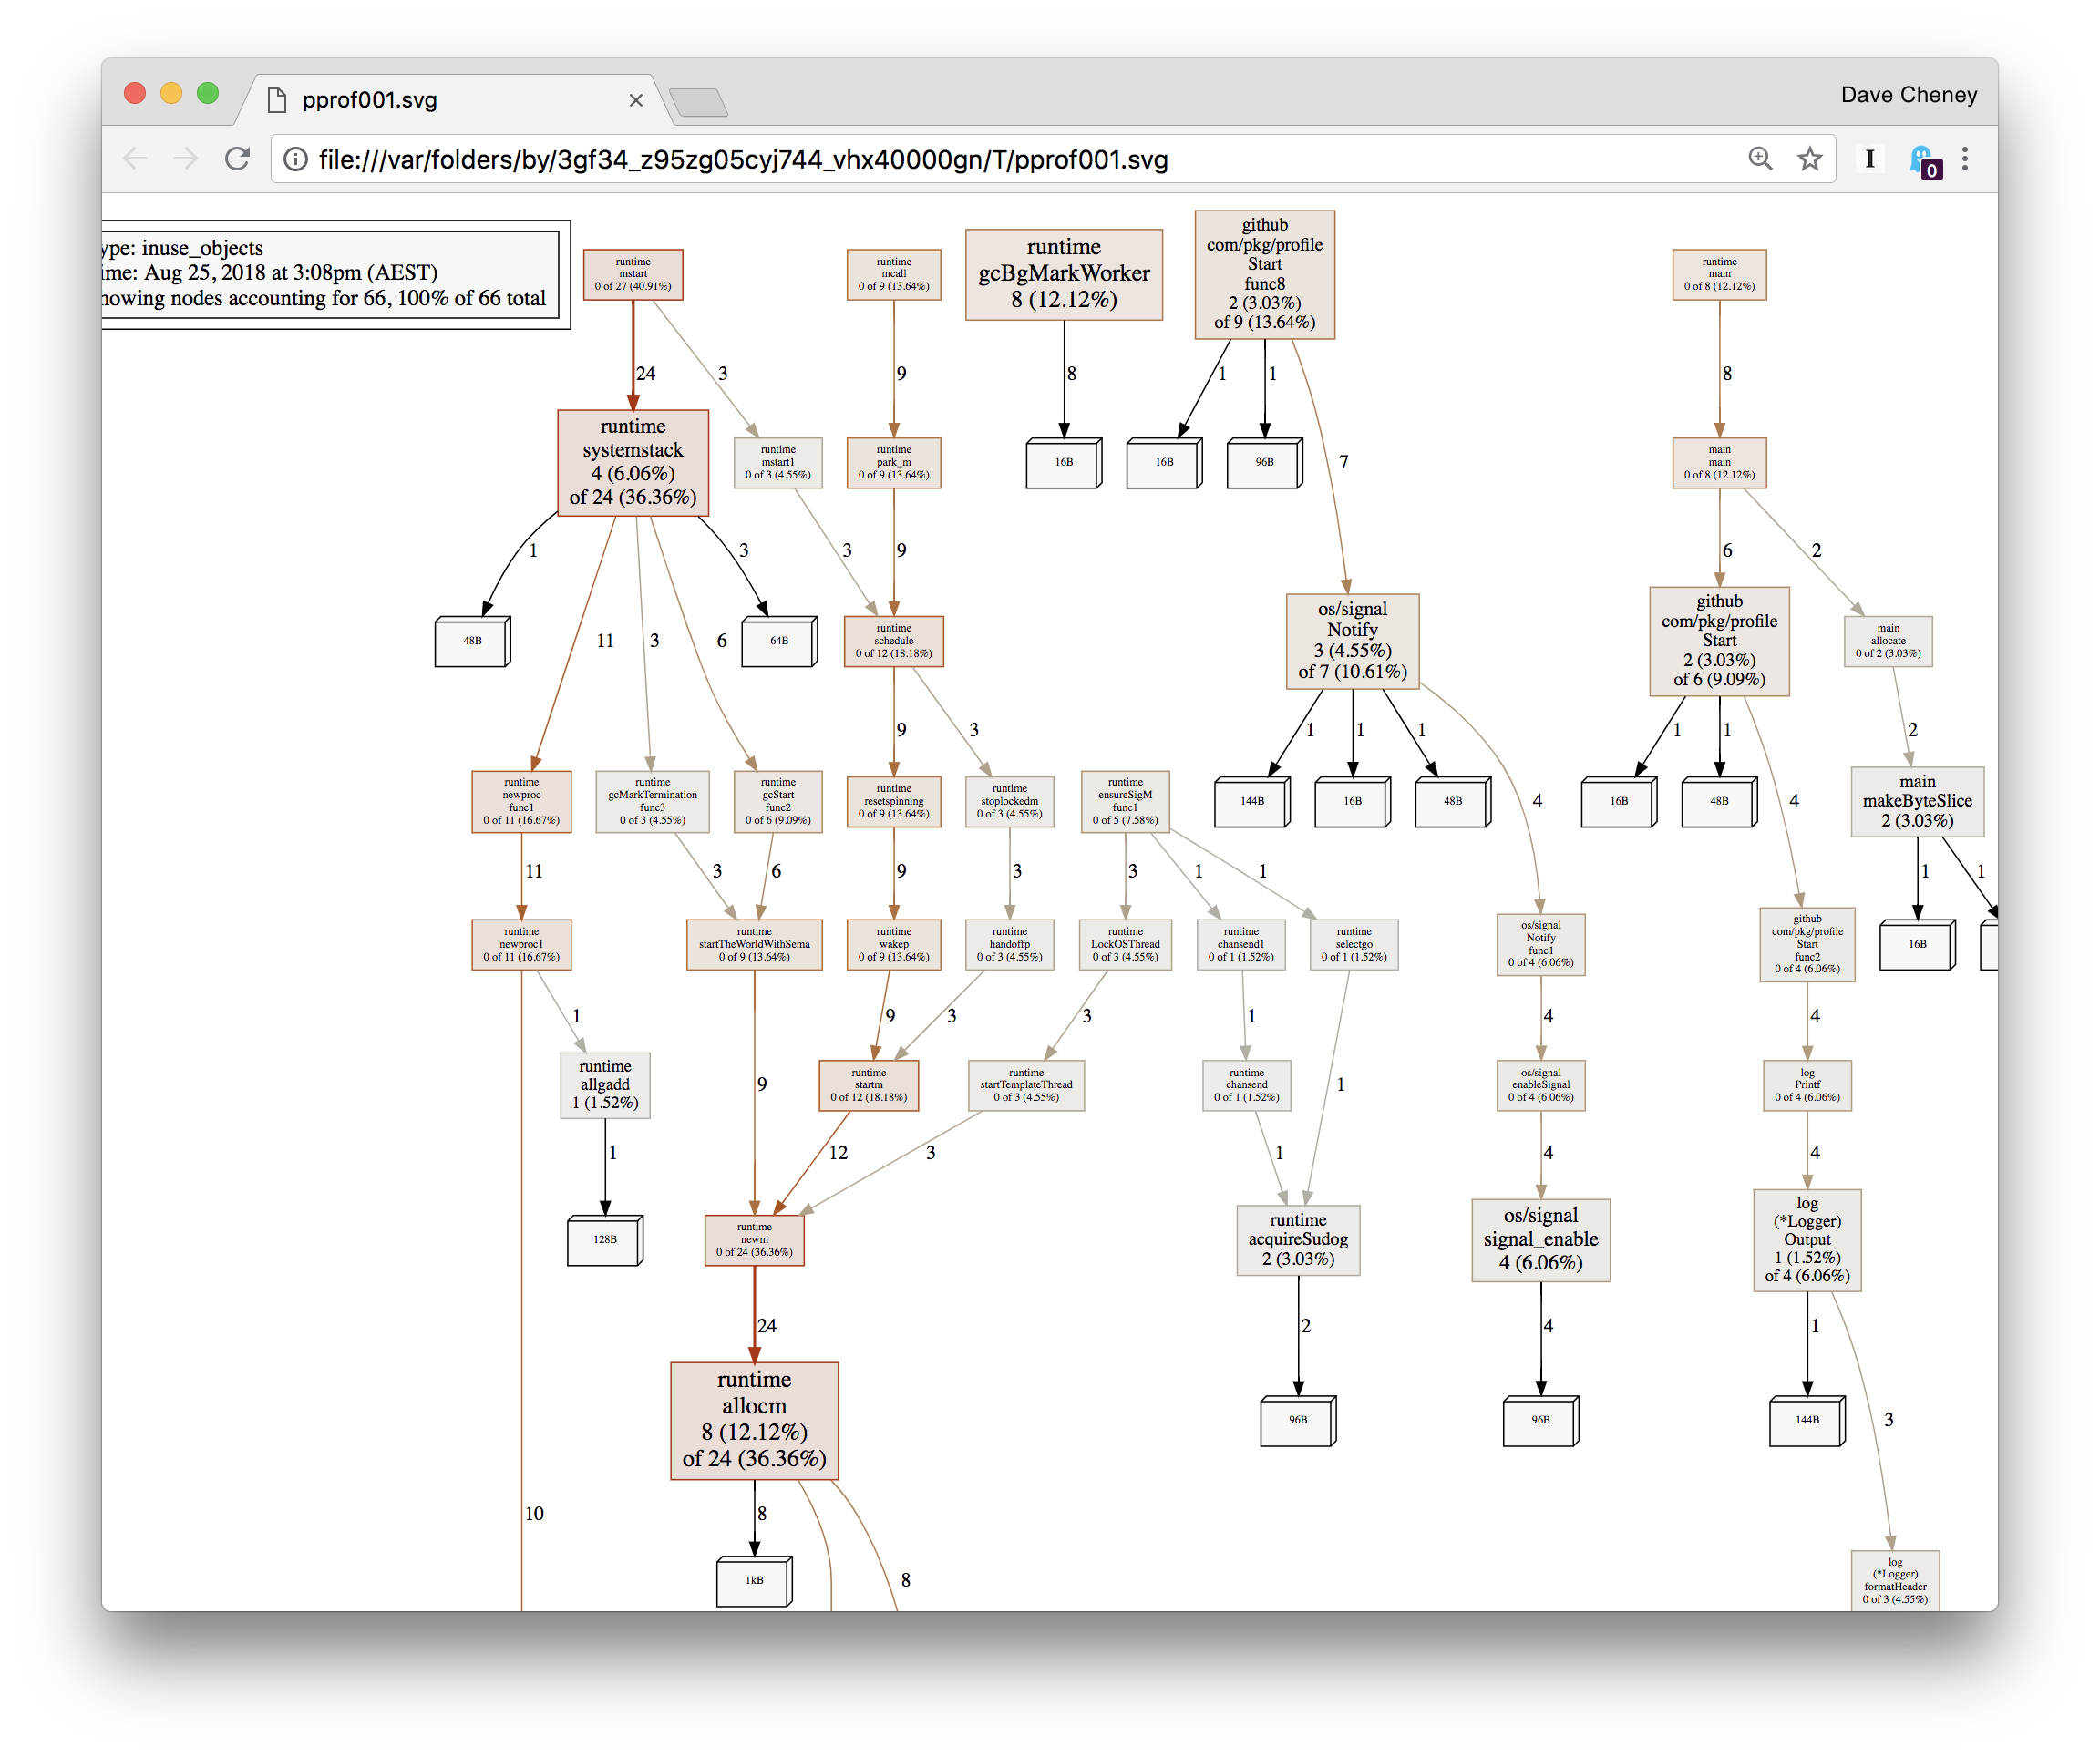
我们看到的不是在 profile 期间分配的对象,而是在 profile 获取时仍在使用的对象——这忽略了垃圾收集器回收的对象的堆栈跟踪。
转载:https://github.com/sxs2473/go-performane-tuning/blob/master/3.%E6%80%A7%E8%83%BD%E6%B5%8B%E9%87%8F%E5%92%8C%E5%88%86%E6%9E%90/%E6%80%A7%E8%83%BD%E6%B5%8B%E9%87%8F%E5%92%8C%E5%88%86%E6%9E%90.md