打印全部堆栈
Stack trace是指堆栈回溯信息,在当前时间,以当前方法的执行点开始,回溯调用它的方法的方法的执行点,然后继续回溯,这样就可以跟踪整个方法的调用
panic
如果应用中有没recover的panic,或者应用在运行的时候出现运行时的异常,那么程序自动会将当前的goroutine的stack trace打印出来。
比如下面的程序,如果你运行会抛出一个panic。
 1
 2
 3
 4
 5
 6
 7
 8
 9
10
11
12
13
14
15
16
17
18
19
20
|
package main
import (
	"time"
)
func main() {
	go a()
	m1()
}
func m1() {
	m2()
}
func m2() {
	m3()
}
func m3() {
	panic("panic from m3")
}
func a() {
	time.Sleep(time.Hour)
}
|
输出下面的stack trace:
 1
 2
 3
 4
 5
 6
 7
 8
 9
10
11
12
13
14
|
dump go run p.go
panic: panic from m3
goroutine 1 [running]:
panic(0x596a0, 0xc42000a1a0)
	/usr/local/Cellar/go/1.7.4/libexec/src/runtime/panic.go:500 +0x1a1
main.m3()
	/Users/yuepan/go/src/github.com/smallnest/dump/p.go:21 +0x6d
main.m2()
	/Users/yuepan/go/src/github.com/smallnest/dump/p.go:17 +0x14
main.m1()
	/Users/yuepan/go/src/github.com/smallnest/dump/p.go:13 +0x14
main.main()
	/Users/yuepan/go/src/github.com/smallnest/dump/p.go:9 +0x3a
exit status 2
|
从这个信息中我们可以看到p.go的第9行是main方法,它在这一行调用m1方法,m1方法在第13行调用m2方法,m2方法在第17行调用m3方法,m3方法在第21出现panic, 它们运行在goroutine 1中,当前goroutine 1的状态是running状态。
如果想让它把所有的goroutine信息都输出出来,可以设置 GOTRACEBACK=1:
 1
 2
 3
 4
 5
 6
 7
 8
 9
10
11
12
13
14
15
16
17
18
19
20
21
|
GOTRACEBACK=1 go run p.go
panic: panic from m3
goroutine 1 [running]:
panic(0x596a0, 0xc42000a1b0)
	/usr/local/Cellar/go/1.7.4/libexec/src/runtime/panic.go:500 +0x1a1
main.m3()
	/Users/yuepan/go/src/github.com/smallnest/dump/p.go:21 +0x6d
main.m2()
	/Users/yuepan/go/src/github.com/smallnest/dump/p.go:17 +0x14
main.m1()
	/Users/yuepan/go/src/github.com/smallnest/dump/p.go:13 +0x14
main.main()
	/Users/yuepan/go/src/github.com/smallnest/dump/p.go:9 +0x3a
goroutine 4 [sleep]:
time.Sleep(0x34630b8a000)
	/usr/local/Cellar/go/1.7.4/libexec/src/runtime/time.go:59 +0xe1
main.a()
	/Users/yuepan/go/src/github.com/smallnest/dump/p.go:25 +0x30
created by main.main
	/Users/yuepan/go/src/github.com/smallnest/dump/p.go:8 +0x35
exit status 2
|
同样你也可以分析这个stack trace的信息,得到方法调用点的情况,同时这个信息将两个goroutine的stack trace都打印出来了,而且goroutine 4的状态是sleep状态。
Go官方文档对这个环境变量有介绍:
1
|
The GOTRACEBACK variable controls the amount of output generated when a Go program fails due to an unrecovered panic or an unexpected runtime condition. By default, a failure prints a stack trace for the current goroutine, eliding functions internal to the run-time system, and then exits with exit code 2. The failure prints stack traces for all goroutines if there is no current goroutine or the failure is internal to the run-time. GOTRACEBACK=none omits the goroutine stack traces entirely. GOTRACEBACK=single (the default) behaves as described above. GOTRACEBACK=all adds stack traces for all user-created goroutines. GOTRACEBACK=system is like “all” but adds stack frames for run-time functions and shows goroutines created internally by the run-time. GOTRACEBACK=crash is like “system” but crashes in an operating system-specific manner instead of exiting. For example, on Unix systems, the crash raises SIGABRT to trigger a core dump. For historical reasons, the GOTRACEBACK settings 0, 1, and 2 are synonyms for none, all, and system, respectively. The runtime/debug package's SetTraceback function allows increasing the amount of output at run time, but it cannot reduce the amount below that specified by the environment variable. See <https://golang.org/pkg/runtime/debug/#SetTraceback>.
|
你可以设置 none、all、system、single、crash,历史原因, 你可以可是设置数字0、1、2,分别代表none、all、system。
SIGQUIT
如果程序没有发生panic,但是程序有问题,“假死“不工作,我们想看看哪儿出现了问题,可以给程序发送SIGQUIT信号,也可以输出stack trace信息。
比如下面的程序:
 1
 2
 3
 4
 5
 6
 7
 8
 9
10
11
12
13
14
15
16
17
18
19
20
|
package main
import (
	"time"
)
func main() {
	go a()
	m1()
}
func m1() {
	m2()
}
func m2() {
	m3()
}
func m3() {
	time.Sleep(time.Hour)
}
func a() {
	time.Sleep(time.Hour)
}
|
你可以运行 kill -SIGQUIT <pid> 杀死这个程序,程序在退出的时候输出strack trace。
pprof.Lookup(“goroutine”).WriteTo
可以通过pprof.Lookup(“goroutine”).WriteTo将所有的goroutine的stack trace都打印出来,如下面的程序:
 1
 2
 3
 4
 5
 6
 7
 8
 9
10
11
12
13
14
15
16
17
18
19
20
21
22
23
|
package main
import (
	"os"
	"runtime/pprof"
	"time"
)
func main() {
	go a()
	m1()
}
func m1() {
	m2()
}
func m2() {
	m3()
}
func m3() {
	pprof.Lookup("goroutine").WriteTo(os.Stdout, 1)
	time.Sleep(time.Hour)
}
func a() {
	time.Sleep(time.Hour)
}
|
debug.PrintStack()
在程序panic的时候,一般会自动把堆栈打出来,如果你想在程序中获取堆栈信息,可以通过debug.PrintStack()打印出来。比如你在程序中遇到一个Error,但是不期望程序panic,只是想把堆栈信息打印出来以便跟踪调试,你可以使用debug.PrintStack()。
该方法只能输出到标准错误输出的fd上。为了能完整输出栈信息,还精细的做了buf的扩充重试。
 1
 2
 3
 4
 5
 6
 7
 8
 9
10
11
12
13
14
15
16
17
18
19
20
21
22
|
package main
import (
	"runtime/debug"
	"time"
)
func main() {
	go a()
	m1()
}
func m1() {
	m2()
}
func m2() {
	m3()
}
func m3() {
	debug.PrintStack()
	time.Sleep(time.Hour)
}
func a() {
	time.Sleep(time.Hour)
}
|
 1
 2
 3
 4
 5
 6
 7
 8
 9
10
11
12
13
14
15
16
17
|
// PrintStack prints to standard error the stack trace returned by runtime.Stack.
func PrintStack() {
	os.Stderr.Write(Stack())
}

// Stack returns a formatted stack trace of the goroutine that calls it.
// It calls runtime.Stack with a large enough buffer to capture the entire trace.
func Stack() []byte {
	buf := make([]byte, 1024)
	for {
		n := runtime.Stack(buf, false)
		if n < len(buf) {
			return buf[:n]
		}
		buf = make([]byte, 2*len(buf))
	}
}
|
runtime.Stack
你可以使用runtime.Stack得到所有的goroutine的stack trace信息,事实上前面debug.PrintStack()也是通过这个方法获得的。
为了更方便的随时的得到应用所有的goroutine的stack trace信息,我们可以监听SIGUSR1信号,当收到这个信号的时候就将stack trace打印出来。发送信号也很简单,通过kill -SIGUSR1 就可以,不必担心kill会将程序杀死,它只是发了一个信号而已。
 1
 2
 3
 4
 5
 6
 7
 8
 9
10
11
12
13
14
15
16
17
18
19
20
21
22
23
24
25
26
27
28
29
30
31
32
33
34
35
36
37
38
39
40
41
42
|
package main
import (
	"fmt"
	"os"
	"os/signal"
	"runtime"
	"syscall"
	"time"
)
func main() {
	setupSigusr1Trap()
	go a()
	m1()
}
func m1() {
	m2()
}
func m2() {
	m3()
}
func m3() {
	time.Sleep(time.Hour)
}
func a() {
	time.Sleep(time.Hour)
}
func setupSigusr1Trap() {
	c := make(chan os.Signal, 1)
	signal.Notify(c, syscall.SIGUSR1)
	go func() {
		for range c {
			DumpStacks()
		}
	}()
}
func DumpStacks() {
	buf := make([]byte, 16384)
	// 获取 所有goroutine 的 stacktrace
	buf = buf[:runtime.Stack(buf, true)]
	// 如果需要获取当前goroutine 的 stacktrace, 第二个参数需要为 `false`
	fmt.Printf("=== BEGIN goroutine stack dump ===\n%s\n=== END goroutine stack dump ===", buf)
}
|
输出结果很直观,方便检查。
 1
 2
 3
 4
 5
 6
 7
 8
 9
10
11
12
13
14
15
16
17
18
19
20
21
22
23
24
25
26
27
28
29
30
31
32
33
34
35
36
37
38
39
40
41
42
43
44
45
|
=== BEGIN goroutine stack dump ===
goroutine 36 [running]:
main.DumpStacks()
	/Users/yuepan/go/src/github.com/smallnest/dump/d3.go:47 +0x77
main.setupSigusr1Trap.func1(0xc420070060)
	/Users/yuepan/go/src/github.com/smallnest/dump/d3.go:40 +0x73
created by main.setupSigusr1Trap
	/Users/yuepan/go/src/github.com/smallnest/dump/d3.go:42 +0xec
goroutine 1 [sleep]:
time.Sleep(0x34630b8a000)
	/usr/local/Cellar/go/1.7.4/libexec/src/runtime/time.go:59 +0xe1
main.m3()
	/Users/yuepan/go/src/github.com/smallnest/dump/d3.go:28 +0x30
main.m2()
	/Users/yuepan/go/src/github.com/smallnest/dump/d3.go:24 +0x14
main.m1()
	/Users/yuepan/go/src/github.com/smallnest/dump/d3.go:20 +0x14
main.main()
	/Users/yuepan/go/src/github.com/smallnest/dump/d3.go:16 +0x3f
goroutine 34 [syscall]:
os/signal.signal_recv(0xff280)
	/usr/local/Cellar/go/1.7.4/libexec/src/runtime/sigqueue.go:116 +0x157
os/signal.loop()
	/usr/local/Cellar/go/1.7.4/libexec/src/os/signal/signal_unix.go:22 +0x22
created by os/signal.init.1
	/usr/local/Cellar/go/1.7.4/libexec/src/os/signal/signal_unix.go:28 +0x41
goroutine 35 [select, locked to thread]:
runtime.gopark(0xb5cc8, 0x0, 0xab3ef, 0x6, 0x18, 0x2)
	/usr/local/Cellar/go/1.7.4/libexec/src/runtime/proc.go:259 +0x13a
runtime.selectgoImpl(0xc42008d730, 0x0, 0x18)
	/usr/local/Cellar/go/1.7.4/libexec/src/runtime/select.go:423 +0x11d9
runtime.selectgo(0xc42008d730)
	/usr/local/Cellar/go/1.7.4/libexec/src/runtime/select.go:238 +0x1c
runtime.ensureSigM.func1()
	/usr/local/Cellar/go/1.7.4/libexec/src/runtime/signal1_unix.go:304 +0x2d1
runtime.goexit()
	/usr/local/Cellar/go/1.7.4/libexec/src/runtime/asm_amd64.s:2086 +0x1
goroutine 37 [sleep]:
time.Sleep(0x34630b8a000)
	/usr/local/Cellar/go/1.7.4/libexec/src/runtime/time.go:59 +0xe1
main.a()
	/Users/yuepan/go/src/github.com/smallnest/dump/d3.go:32 +0x30
created by main.main
	/Users/yuepan/go/src/github.com/smallnest/dump/d3.go:15 +0x3a
=== END goroutine stack dump ===
|
 1
 2
 3
 4
 5
 6
 7
 8
 9
10
11
12
13
14
15
16
17
18
19
20
21
22
23
24
25
26
27
28
29
30
31
32
33
34
35
36
37
|
// Stack formats a stack trace of the calling goroutine into buf
// and returns the number of bytes written to buf.
// If all is true, Stack formats stack traces of all other goroutines
// into buf after the trace for the current goroutine.
func Stack(buf []byte, all bool) int {
	if all {
		stopTheWorld("stack trace")
	}

	n := 0
	if len(buf) > 0 {
		gp := getg()
		sp := getcallersp()
		pc := getcallerpc()
		systemstack(func() {
			g0 := getg()
			// Force traceback=1 to override GOTRACEBACK setting,
			// so that Stack's results are consistent.
			// GOTRACEBACK is only about crash dumps.
			g0.m.traceback = 1
			g0.writebuf = buf[0:0:len(buf)]
			goroutineheader(gp)
			traceback(pc, sp, 0, gp)
			if all {
				tracebackothers(gp)
			}
			g0.m.traceback = 0
			n = len(g0.writebuf)
			g0.writebuf = nil
		})
	}

	if all {
		startTheWorld()
	}
	return n
}
|
当all=false时,只会获取当前协程的函数调用栈信息,无需加锁。但all=true时,意味着要获取所有协程的栈信息,在go runtime的pmg调度模型下,为了保证并发操作安全,自然就需要在stack方法里加了锁,且锁的粒度还不小,直接调用stopTheWorld用来阻塞GC的操作。
goroutineheader方法用来获取协程的状态信息,比如等待锁,scan,已等待时间等。allgs是runtime保存的所有已创建协程的容器,当然不会去追踪已经消亡的协程。另外,为了保护allgs切片的安全,还会对allglock加锁,在allgadd()创建goroutine和checkdead()检测死锁里会产生锁竞争。
 1
 2
 3
 4
 5
 6
 7
 8
 9
10
11
12
13
14
15
16
17
18
19
20
21
22
23
24
25
26
27
28
29
30
31
32
33
34
35
36
|
func goroutineheader(gp *g) {
	gpstatus := readgstatus(gp)

	isScan := gpstatus&_Gscan != 0
	gpstatus &^= _Gscan // drop the scan bit

	// Basic string status
	var status string
	if 0 <= gpstatus && gpstatus < uint32(len(gStatusStrings)) {
		status = gStatusStrings[gpstatus]
	} else {
		status = "???"
	}

	// Override.
	if gpstatus == _Gwaiting && gp.waitreason != waitReasonZero {
		status = gp.waitreason.String()
	}

	// approx time the G is blocked, in minutes
	var waitfor int64
	if (gpstatus == _Gwaiting || gpstatus == _Gsyscall) && gp.waitsince != 0 {
		waitfor = (nanotime() - gp.waitsince) / 60e9
	}
	print("goroutine ", gp.goid, " [", status)
	if isScan {
		print(" (scan)")
	}
	if waitfor >= 1 {
		print(", ", waitfor, " minutes")
	}
	if gp.lockedm != 0 {
		print(", locked to thread")
	}
	print("]:\n")
}
|
http/pprof
如果你的代码中配置了 http/pprof,你可以通过下面的地址访问所有的groutine的堆栈:
1
|
<http://localhost:8888/debug/pprof/goroutine?debug=2>.
|
更可控的调用信息
上面的函数虽然可以获取调用栈,但是直接将所有调用信息返回,控制参数较少。
下面几个函数可以实现获取单层的调用信息。
runtime.Caller
1
|
runtime.Caller(skip int) (pc uintptr, file string, line int, ok bool)
|
runtime.Caller 返回当前 goroutine 的栈上的函数调用信息. 主要有当前的pc 值和调用的文件和行号等信息.
- 参数skip:表示跳过的层级,相当于往上获取第几层的调用者。若为 0 则表示 runtime.Caller 的调用者。1 代表上一层调用者,以此类推。
- 返回值
- pc:program counter,可以大概理解为函数编号,可以通过runtime.FuncForPC解析.
- file:文件名
- line:行号
- ok:若无法获得信息, 返回的 ok 值为 false.
 1
 2
 3
 4
 5
 6
 7
 8
 9
10
11
12
13
14
15
16
17
18
|
func main() {
	Foo()
}
func Foo() {
	fmt.Printf("我是 %s, %s 在调用我!\n", printMyName(), printCallerName())
	Bar()
}
func Bar() {
	fmt.Printf("我是 %s, %s 又在调用我!\n", printMyName(), printCallerName())
}
func printMyName() string {
	pc, _, _, _ := runtime.Caller(1)
	return runtime.FuncForPC(pc).Name()
}
func printCallerName() string {
	pc, _, _, _ := runtime.Caller(2)
	return runtime.FuncForPC(pc).Name()
}
|
可以得到这样一条输出:
1
2
|
我是 main.Foo, 谁在调用我?
我是 main.Bar, 谁又在调用我?
|
runtime.Callers
1
|
runtime.Callers(skip int, pc []uintptr) int
|
runtime.Callers 把调用它的函数Go程栈上的程序计数器填入切片 pc 中. 参数 skip 为开始在 pc 中记录之前所要跳过的栈帧数, 若为 0 则表示 runtime.Callers 自身的栈帧, 若为 1 则表示调用者的栈帧. 该函数返回写入到 pc 切片中的项数(受切片的容量限制).
 1
 2
 3
 4
 5
 6
 7
 8
 9
10
11
12
13
14
|
……
func Bar() {
	fmt.Printf("我是 %s, %s 又在调用我!\n", printMyName(), printCallerName())
	trace()
}
func trace() {
	pc := make([]uintptr, 10) // at least 1 entry needed
	n := runtime.Callers(0, pc)
	for i := 0; i < n; i++ {
		f := runtime.FuncForPC(pc[i])
		file, line := f.FileLine(pc[i])
		fmt.Printf("%s:%d %s\n", file, line, f.Name())
	}
}
|
输出结果可以看到这个goroutine的整个栈都打印出来了:
1
2
3
4
5
6
7
|
/usr/local/go/src/runtime/extern.go:218 runtime.Callers
/Users/yuepan/go/src/git.intra.weibo.com/platform/tool/g/main.go:34 main.trace
/Users/yuepan/go/src/git.intra.weibo.com/platform/tool/g/main.go:20 main.Bar
/Users/yuepan/go/src/git.intra.weibo.com/platform/tool/g/main.go:15 main.Foo
/Users/yuepan/go/src/git.intra.weibo.com/platform/tool/g/main.go:10 main.main
/usr/local/go/src/runtime/proc.go:210 runtime.main
/usr/local/go/src/runtime/asm_amd64.s:1334 runtime.goexit
|
runtime.FuncForPC
FuncForPC 是一个有趣的函数, 它可以把程序计数器地址对应的函数的信息获取出来。如果因为内联程序计数器对应多个函数,它返回最外面的函数。
它的返回值是一个Func类型的值,通过Func可以获得函数地址、文件行、函数名等信息。
1
2
3
4
|
func runtime.FuncForPC(pc uintptr) *runtime.Func
func (f *runtime.Func) FileLine(pc uintptr) (file string, line int)
func (f *runtime.Func) Entry() uintptr
func (f *runtime.Func) Name() string
|
其中 runtime.FuncForPC 返回包含给定 pc 地址的函数, 如果是无效 pc 则返回 nil .
runtime.Func.FileLine 返回与 pc 对应的源码文件名和行号. 如果pc不在函数帧范围内, 则结果是不确定的.
runtime.Func.Entry 对应函数的地址. runtime.Func.Name 返回该函数的名称.
 1
 2
 3
 4
 5
 6
 7
 8
 9
10
11
12
13
14
15
16
17
18
19
20
21
22
23
24
25
26
27
28
29
30
31
32
33
34
35
36
37
38
39
40
41
42
43
44
45
46
47
48
49
50
51
52
53
54
55
56
57
58
59
60
61
62
63
64
|
func main() {
	for skip := 0; ; skip++ {
		pc, _, _, ok := runtime.Caller(skip)
		if !ok {
			break
		}
		p := runtime.FuncForPC(pc)
		file, line := p.FileLine(0)

		fmt.Printf("skip = %v, pc = %v\n", skip, pc)
		fmt.Printf("  file = %v, line = %d\n", file, line)
		fmt.Printf("  entry = %v\n", p.Entry())
		fmt.Printf("  name = %v\n", p.Name())
	}
	// Output:
	// skip = 0, pc = 4198456
	//   file = caller.go, line = 8
	//   entry = 4198400
	//   name = main.main
	// skip = 1, pc = 4282882
	//   file = $(GOROOT)/src/pkg/runtime/proc.c, line = 179
	//   entry = 4282576
	//   name = runtime.main
	// skip = 2, pc = 4292528
	//   file = $(GOROOT)/src/pkg/runtime/proc.c, line = 1394
	//   entry = 4292528
	//   name = runtime.goexit
	pc := make([]uintptr, 1024)
	for skip := 0; ; skip++ {
		n := runtime.Callers(skip, pc)
		if n <= 0 {
			break
		}
		fmt.Printf("skip = %v, pc = %v\n", skip, pc[:n])
		for j := 0; j < n; j++ {
			p := runtime.FuncForPC(pc[j])
			file, line := p.FileLine(0)

			fmt.Printf("  skip = %v, pc = %v\n", skip, pc[j])
			fmt.Printf("    file = %v, line = %d\n", file, line)
			fmt.Printf("    entry = %v\n", p.Entry())
			fmt.Printf("    name = %v\n", p.Name())
		}
		break
	}
	// Output:
	// skip = 0, pc = [4307254 4198586 4282882 4292528]
	//   skip = 0, pc = 4307254
	//     file = $(GOROOT)/src/pkg/runtime/runtime.c, line = 315
	//     entry = 4307168
	//     name = runtime.Callers
	//   skip = 0, pc = 4198586
	//     file = caller.go, line = 8
	//     entry = 4198400
	//     name = main.main
	//   skip = 0, pc = 4282882
	//     file = $(GOROOT)/src/pkg/runtime/proc.c, line = 179
	//     entry = 4282576
	//     name = runtime.main
	//   skip = 0, pc = 4292528
	//     file = $(GOROOT)/src/pkg/runtime/proc.c, line = 1394
	//     entry = 4292528
	//     name = runtime.goexit
}
|
除了上面获取程序计数器的方式,也可以通过反射的方式获取函数的地址:
1
|
runtime.FuncForPC(reflect.ValueOf(foo).Pointer()).Name()
|
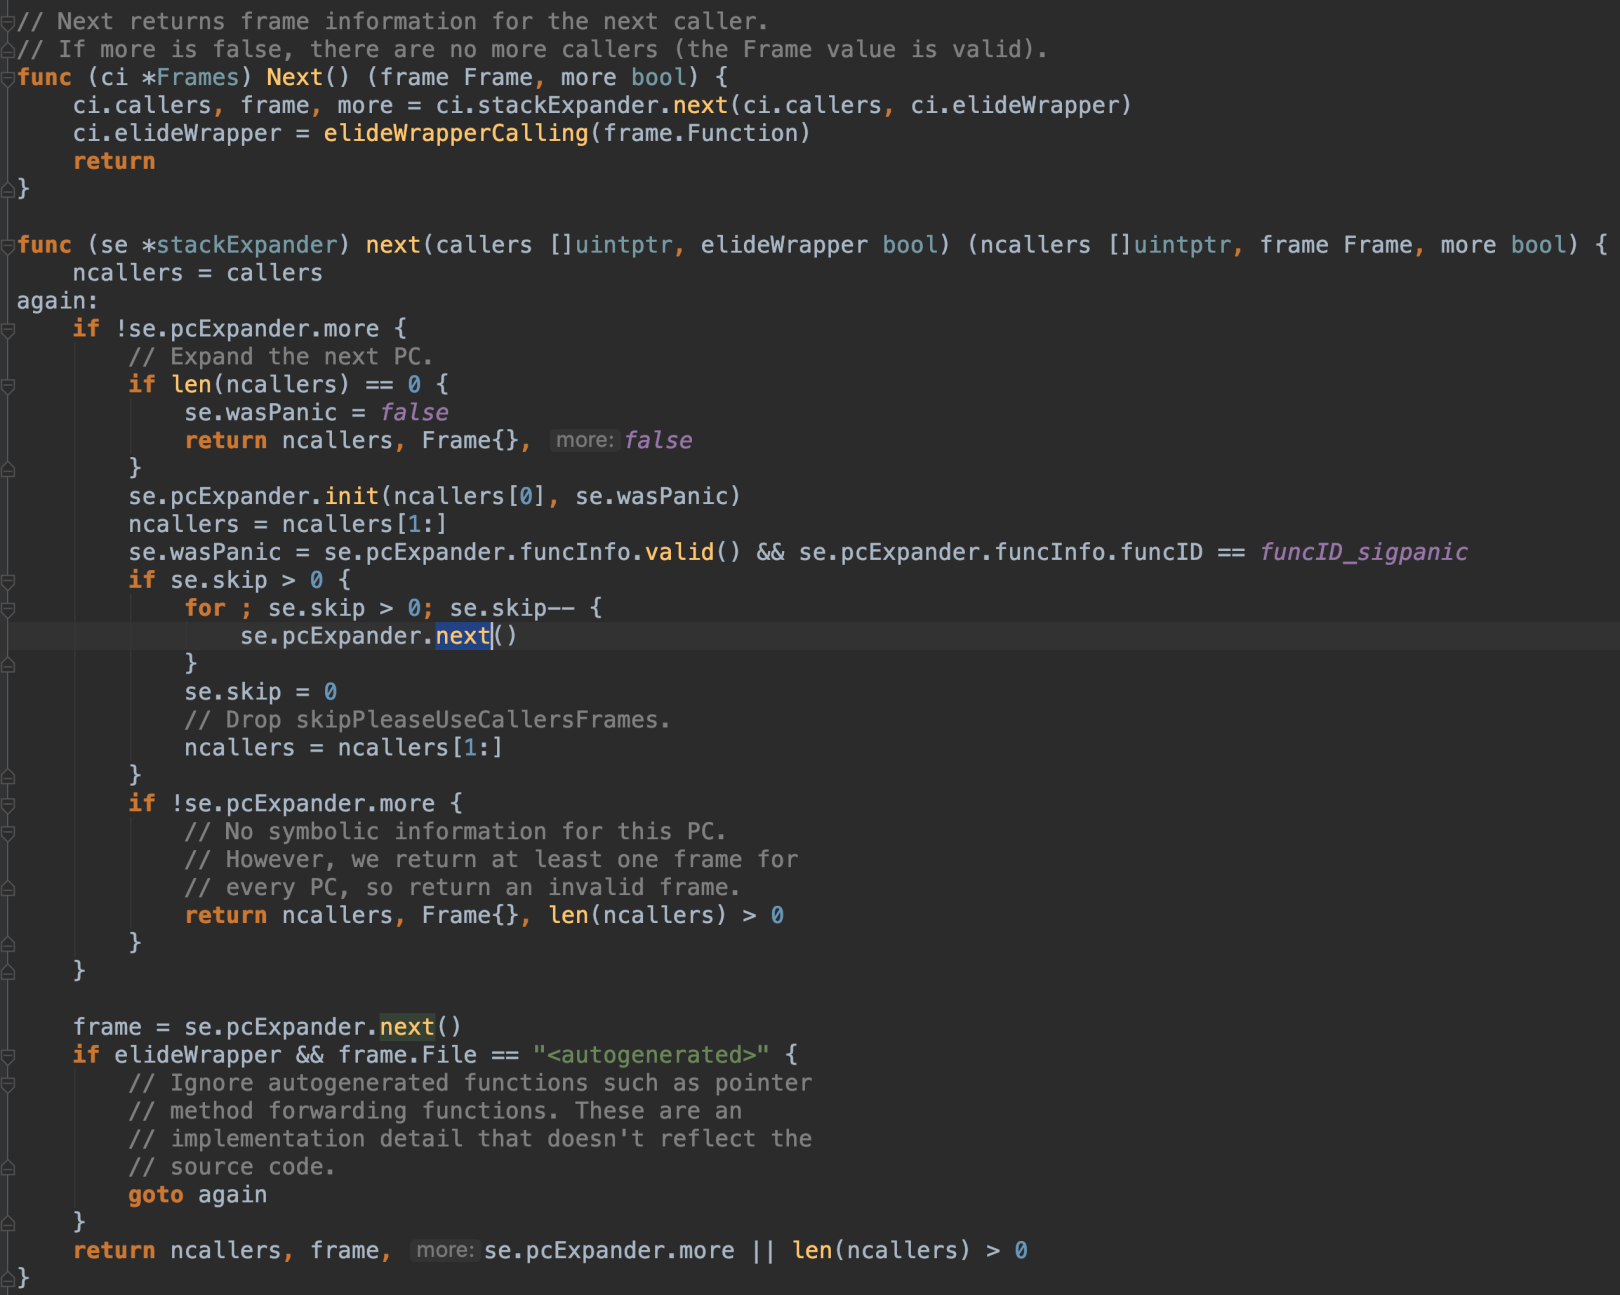
runtime.CallersFrames
上面的Callers只是或者栈的程序计数器,如果想获得整个栈的信息,可以使用CallersFrames函数,省去遍历调用FuncForPC。
1
|
runtime.CallersFrames(callers []uintptr) *runtime.Frames
|
runtime.CallersFrames可以一次解析多个pc
上面的trace函数可以更改为下面的方式:
 1
 2
 3
 4
 5
 6
 7
 8
 9
10
11
12
|
func trace2() {
	pc := make([]uintptr, 10) // at least 1 entry needed
	n := runtime.Callers(0, pc)
	frames := runtime.CallersFrames(pc[:n])
	for {
		frame, more := frames.Next()
		fmt.Printf("%s:%d %s\n", frame.File, frame.Line, frame.Function)
		if !more {
			break
		}
	}
}
|
获取goroutine的id
 1
 2
 3
 4
 5
 6
 7
 8
 9
10
|
func GoID() int {
	var buf [64]byte
	n := runtime.Stack(buf[:], false)
	idField := strings.Fields(strings.TrimPrefix(string(buf[:n]), "goroutine "))[0]
	id, err := strconv.Atoi(idField)
	if err != nil {
		panic(fmt.Sprintf("cannot get goroutine id: %v", err))
	}
	return id
}
|
打印堆栈的性能问题
背景
runtime.Caller能够拿到当前执行的文件名和行号,这个方法几乎所有的日志组件里都有使用。
1
|
func Caller(skip int) (pc uintptr, file string, line int, ok bool) {}
|
但是问题也很明显,这个函数开销太大。跟了一下代码实现,发现主要就是不停地迭代,而这个迭代过程虽然单次消耗的时间可以忽略不计,但是对于日志量巨大的服务而言影响还是很大的。详情参见下面的代码
解决方案
网上了解了一下,目前没有找到不使用runtime包获取执行文件和行号的解决方案。既然官方的包很难有优化空间,那可以考虑一下业务侧有什么解决方案。于是查了一些github上比较知名的项目,学习了一下。
标准库log
官方写的日志组件,在log包里的,值得参考一下:
 1
 2
 3
 4
 5
 6
 7
 8
 9
10
11
12
13
14
15
16
17
18
19
20
21
22
23
24
25
26
27
28
29
30
31
32
|
// Output writes the output for a logging event. The string s contains
// the text to print after the prefix specified by the flags of the
// Logger. A newline is appended if the last character of s is not
// already a newline. Calldepth is used to recover the PC and is
// provided for generality, although at the moment on all pre-defined
// paths it will be 2.
func (l *Logger) Output(calldepth int, s string) error {
	now := time.Now() // get this early.
	var file string
	var line int
	l.mu.Lock()
	defer l.mu.Unlock()
	if l.flag&(Lshortfile|Llongfile) != 0 {
		// Release lock while getting caller info - it's expensive.
		l.mu.Unlock()
		var ok bool
		_, file, line, ok = runtime.Caller(calldepth)
		if !ok {
			file = "???"
			line = 0
		}
		l.mu.Lock()
	}
	l.buf = l.buf[:0]
	l.formatHeader(&l.buf, now, file, line)
	l.buf = append(l.buf, s...)
	if len(s) == 0 || s[len(s)-1] != '\n' {
		l.buf = append(l.buf, '\n')
	}
	_, err := l.out.Write(l.buf)
	return err
}
|
注释里说明官方也是知道runtime.Caller性能有问题。这里的Logger里带有一个Mutex锁,方便在高并发或者多协程的时候保护上下文数据一致。
这里值得借鉴的是并没有所有的日志都记录文件名和行号,而是添加了标记位flag,只有在需要的业务场景下(Lshortfile或者Llongfile ),才调用runtime.Caller,避免不必要的开支。
另外一方面,在调用性能比较差的runtime.Caller之前,把锁释放,执行完毕后再把锁加上,继续处理自己后续的业务。这个可以避免锁的时间过长,影响其他业务。
zap
看一下实现行号和文件名的代码:
 1
 2
 3
 4
 5
 6
 7
 8
 9
10
11
12
13
14
15
16
17
18
19
20
21
22
23
24
25
26
27
28
29
30
31
32
33
34
35
36
37
38
39
40
41
42
43
44
45
46
47
48
49
50
51
52
53
54
55
56
57
58
59
60
61
62
63
64
65
66
67
68
69
70
|
func (log *Logger) check(lvl zapcore.Level, msg string) *zapcore.CheckedEntry {
	// check must always be called directly by a method in the Logger interface
	// (e.g., Check, Info, Fatal).
	const callerSkipOffset = 2

	// Check the level first to reduce the cost of disabled log calls.
	// Since Panic and higher may exit, we skip the optimization for those levels.
	if lvl < zapcore.DPanicLevel && !log.core.Enabled(lvl) {
		return nil
	}

	// Create basic checked entry thru the core; this will be non-nil if the
	// log message will actually be written somewhere.
	ent := zapcore.Entry{
		LoggerName: log.name,
		Time:       time.Now(),
		Level:      lvl,
		Message:    msg,
	}
	ce := log.core.Check(ent, nil)
	willWrite := ce != nil

	// Set up any required terminal behavior.
	switch ent.Level {
	case zapcore.PanicLevel:
		ce = ce.Should(ent, zapcore.WriteThenPanic)
	case zapcore.FatalLevel:
		onFatal := log.onFatal
		// Noop is the default value for CheckWriteAction, and it leads to
		// continued execution after a Fatal which is unexpected.
		if onFatal == zapcore.WriteThenNoop {
			onFatal = zapcore.WriteThenFatal
		}
		ce = ce.Should(ent, onFatal)
	case zapcore.DPanicLevel:
		if log.development {
			ce = ce.Should(ent, zapcore.WriteThenPanic)
		}
	}

	// Only do further annotation if we're going to write this message; checked
	// entries that exist only for terminal behavior don't benefit from
	// annotation.
	if !willWrite {
		return ce
	}

	// Thread the error output through to the CheckedEntry.
	ce.ErrorOutput = log.errorOutput
	if log.addCaller {
		frame, defined := getCallerFrame(log.callerSkip + callerSkipOffset)
		if !defined {
			fmt.Fprintf(log.errorOutput, "%v Logger.check error: failed to get caller\n", time.Now().UTC())
			log.errorOutput.Sync()
		}

		ce.Entry.Caller = zapcore.EntryCaller{
			Defined:  defined,
			PC:       frame.PC,
			File:     frame.File,
			Line:     frame.Line,
			Function: frame.Function,
		}
	}
	if log.addStack.Enabled(ce.Entry.Level) {
		ce.Entry.Stack = StackSkip("", log.callerSkip+callerSkipOffset).String
	}

	return ce
}
|
它们将Caller信息放在CallerEntry.Entry.Caller结构里,并且和google类似,提供了标记位(addCaller),只有在需要的场景下才会调用runtime.Caller.
值得一提的是,zap提供了Sugar和Desugar的模式,所谓Sugar就是提供程序员更友好方便的日志记录方式,但是牺牲了部分性能,核心就是Caller的skipCaller+2。Desugar就是个逆向的过程,可以将Sugared的结构再次回退到性能较高的原始模式,核心是Caller的callerSkip-2。两者可以在代码里面共同存在使用。
Sugar和Desuagr的实现:
 1
 2
 3
 4
 5
 6
 7
 8
 9
10
11
12
13
14
15
16
17
18
19
20
21
|
//go.uber.org/zap/logger.go#L126

// Sugar wraps the Logger to provide a more ergonomic, but slightly slower,
// API. Sugaring a Logger is quite inexpensive, so it's reasonable for a
// single application to use both Loggers and SugaredLoggers, converting
// between them on the boundaries of performance-sensitive code.
func (log *Logger) Sugar() *SugaredLogger {
	core := log.clone()
	core.callerSkip += 2
	return &SugaredLogger{core}
}

// Desugar unwraps a SugaredLogger, exposing the original Logger. Desugaring
// is quite inexpensive, so it's reasonable for a single application to use
// both Loggers and SugaredLoggers, converting between them on the boundaries
// of performance-sensitive code.
func (s *SugaredLogger) Desugar() *Logger {
	base := s.base.clone()
	base.callerSkip -= 2
	return base
}
|
顺便在这里提一下受zap启发的zerolog项目( https://github.com/rs/zerolog ),zerolog更是将行号和文件名的开关提到了顶层位置,使用时需要手动触发(log.With().Caller())才会去调用Caller: github.com/rs/zerolog/event.go#L635
 1
 2
 3
 4
 5
 6
 7
 8
 9
10
11
12
13
14
15
16
17
18
19
20
21
22
23
24
25
26
27
28
29
30
31
32
33
34
35
|
//add file name and file line number to log

log.Logger = log.With().Caller().Logger()

log.Info().Msg("hello world")

// Caller adds the file:line of the caller with the zerolog.CallerFieldName key.

func (e *Event) Caller()*Event {

    return e.caller(CallerSkipFrameCount)

}

func (e *Event) caller(skip int)*Event {

    if e == nil {

        return e

    }

    _, file, line, ok := runtime.Caller(skip)

    if !ok {

        return e

    }

    e.buf = enc.AppendString(enc.AppendKey(e.buf, CallerFieldName), file+":"+strconv.Itoa(line))

    return e

}
|
参考
调试利器:dump goroutine 的 stacktrace
go runtime.stack加锁引起高时延及阻塞
在 Golang 中打印调用栈信息
如何在Go的函数中得到调用者函数名?
深入学习 Go 语言函数调用信息
golang日志组件使用runtime.Caller性能问题分析