简介
什么是pprof
代码上线前,我们通过压测可以获知系统的性能,例如每秒能处理的请求数,平均响应时间,错误率等指标。这样,我们对自己服务的性能算是有个底。
但是压测是线下的模拟流量,如果到了线上呢?会遇到高并发、大流量,不靠谱的上下游,突发的尖峰流量等等场景,这些都是不可预知的。
线上突然大量报警,接口超时,错误数增加,除了看日志、监控,就是用性能分析工具分析程序的性能,找到瓶颈。当然,一般这种情形不会让你有机会去分析,降级、限流、回滚才是首先要做的,要先止损嘛。回归正常之后,通过线上流量回放,或者压测等手段,制造性能问题,再通过工具来分析系统的瓶颈。
一般而言,性能分析主要关注 CPU、内存、磁盘 IO、网络这些指标。
Profiling 是指在程序执行过程中,收集能够反映程序执行状态的数据。在软件工程中,性能分析(performance analysis,也称为 profiling),是以收集程序运行时信息为手段研究程序行为的分析方法,是一种动态程序分析的方法。
pprof 以 profile.proto 读取分析样本的集合,并生成报告以可视化并帮助分析数据(支持文本和图形报告)
profile.proto 是一个 Protocol Buffer v3 的描述文件,它描述了一组 callstack 和 symbolization 信息, 作用是表示统计分析的一组采样的调用栈,是很常见的 stacktrace 配置文件格式
关注指标
在 go 语言中,主要关注的应用运行情况主要包括以下几种:
- CPU Profiling:CPU分析
- Memory Profiling:内存分析
- Block Profiling:阻塞分析
- Mutex Profiling:互斥锁分析,报告互斥锁的竞争情况
CPU分析
CPU 分析是最常见的类型,也是最明显的。按照一定的频率采集所监听的应用程序 CPU(含寄存器)的使用情况,可确定应用程序在主动消耗 CPU 周期时花费时间的位置.
当 CPU 性能分析启用后,Go runtime 会每 10ms 就暂停一下,记录当前运行的 goroutine 的调用堆栈及相关数据。当性能分析数据保存到硬盘后,我们就可以分析代码中的热点了。
函数在分析文件中出现的次数越多,代码路径占总运行时间的百分比就越多。一旦分析文件完成,我们就可以解析它以确定运行时间最长的代码路径。
内存分析
在应用程序进行堆分配时记录堆栈跟踪,用于监视当前和历史内存使用情况,以及检查内存泄漏.
- 堆(Heap) 分配的时候,记录调用堆栈。
- 栈(Stack) 分配由于会随时释放,因此不会被内存分析所记录。
内存分析,就像 CPU 分析是基于样本的一样,默认情况下,每 1000 个分配中有 1 个内存分析样本。这个速率是可以改变的。
由于内存分析是基于样本的,并且因为它也跟踪尚没被使用的分配,因此使用内存分析来确定应用程序的总内存使用量是很困难的。
阻塞分析
阻塞分析非常独特。记录 goroutine 阻塞等待同步(包括定时器通道)的位置
阻塞 profile 和 CPU profile 非常类似,但它记录了 goroutine 等待共享资源所花费的时间。
这对于确定应用程序中的并发瓶颈非常有用。
阻塞分析可以向你展示大量 goroutine 何时可以取得进展但是被阻塞了。包括:
- 在没有缓冲的 channel 上发送或接收
- 向已满的 channel 发送,或从一个空 channel 接收
- 试图 Lock 一个已经被另一个 goroutine 锁定的 sync.Mutex
阻塞分析是一个非常专业的工具,在你认为已经消除了所有 CPU 和内存使用瓶颈之前,不应该使用它。
互斥锁分析
互斥锁分析与阻塞分析类似,但只关注互斥锁竞争导致延迟的操作。
性能数据
pprof 是 Go 语言中分析程序运行性能的工具,它能提供各种性能数据:
allocs 和 heap 采样的信息一致,不过前者是所有对象的内存分配,而 heap 则是活跃对象的内存分配。
使用模式
- Report generation:报告生成
- Interactive terminal use:交互式终端使用
- Web interface:Web 界面
profile的成本
profile 记录是有成本的
profile 分析对程序性能有一种适度但可衡量的影响, 尤其是在增加内存分析采样率的情况下。
大多数工具不会阻止你同时启用多个 profile 。
但还是不要一次启用多个 profile 。
如果你同时启用多个 profile,他们将观察自己的互动并抛弃你的结果。
两种收集方式
做 Profiling 第一步就是怎么获取应用程序的运行情况数据。go 语言提供了 runtime/pprof 和 net/http/pprof 两个库,这部分我们讲讲它们的用法以及使用场景。
工具型应用
如果你的应用是一次性的,运行一段时间就结束。那么最好的办法,就是在应用退出的时候把 profiling 的报告保存到文件中,进行分析。对于这种情况,可以使用 runtime/pprof 库。
pprof 封装了很好的接口供我们使用,比如要想进行 CPU Profiling,可以调用 pprof.StartCPUProfile() 方法,它会对当前应用程序进行 CPU profiling,并写入到提供的参数中(w io.Writer),要停止调用 StopCPUProfile() 即可。
去除错误处理只需要三行内容,一般把部分内容写在 main.go 文件中,应用程序启动之后就开始执行:
1
2
3
4
|
f, err := os.Create(*cpuprofile)
...
pprof.StartCPUProfile(f)
defer pprof.StopCPUProfile()
|
应用执行结束后,就会生成一个文件,保存了我们的 CPU profiling 数据。
想要获得内存的数据,直接使用 WriteHeapProfile 就行,不用 start 和 stop 这两个步骤了:
1
2
3
|
f, err := os.Create(*memprofile)
pprof.WriteHeapProfile(f)
f.Close()
|
代码示例:
 1
 2
 3
 4
 5
 6
 7
 8
 9
10
11
12
13
14
15
16
17
18
19
20
21
22
23
24
25
|
package main

import (
	"fmt"
	"log"
	"os"
	"runtime/pprof"
)

func main() {
	f, err := os.Create("cpu-profile.prof")
	if err != nil {
		log.Fatal(err)
	}
	pprof.StartCPUProfile(f)
	fmt.Println(fibonacci(45))
	pprof.StopCPUProfile()
}

func fibonacci(n int) int {
	if n < 2 {
		return n
	}
	return fibonacci(n-1) + fibonacci(n-2)
}
|
编译以后,运行程序便可以生成 cpu-profile.prof 文件。使用 go tool pprof finabocci cpu-profile.prof 进入 Profiling 控制台,输入web 指令跳入浏览器中查看 Golang 为我们生成的可视化性能数据。
服务型应用
如果你的应用是一直运行的,比如 web 应用,那么可以使用 net/http/pprof 库,它能够在提供 HTTP 服务进行分析。
如果使用了默认的 http.DefaultServeMux(通常是代码直接使用 http.ListenAndServe(“0.0.0.0:8000”, nil)),只需要添加一行:
1
|
import _ "net/http/pprof"
|
如果你使用自定义的 Mux,则需要手动注册一些路由规则:
1
2
3
4
5
|
r.HandleFunc("/debug/pprof/", pprof.Index)
r.HandleFunc("/debug/pprof/cmdline", pprof.Cmdline)
r.HandleFunc("/debug/pprof/profile", pprof.Profile)
r.HandleFunc("/debug/pprof/symbol", pprof.Symbol)
r.HandleFunc("/debug/pprof/trace", pprof.Trace)
|
不管哪种方式,你的 HTTP 服务都会多出 /debug/pprof endpoint,使用示例:
 1
 2
 3
 4
 5
 6
 7
 8
 9
10
11
12
13
14
15
16
17
18
19
20
21
22
23
24
25
26
27
28
29
30
31
|
package main

import (
	"fmt"
	"log"
	"net/http"
	_ "net/http/pprof"
	"time"
)

func sayHelloHandler(w http.ResponseWriter, r *http.Request) {
	hellowold(10000)
	fmt.Println("path", r.URL.Path)
	fmt.Println("scheme", r.URL.Scheme)
	fmt.Fprintf(w, "Hello world!\n") //这个写入到w的是输出到客户端的
}

func main() {
	http.HandleFunc("/", sayHelloHandler) //	设置访问路由
	log.Fatal(http.ListenAndServe(":8080", nil))
}

func hellowold(times int) {
	time.Sleep(time.Second)
	var counter int
	for i := 0; i < times; i++ {
		for j := 0; j < times; j++ {
			counter++
		}
	}
}
|
之后可通过 http://localhost:8080/debug/pprof/CMD 获取对应的采样数据。支持的 CMD 有:
- goroutine: 获取程序当前所有 goroutine 的堆栈信息。运行的 goroutines 列表,以及调用关系。
- heap: 包含每个 goroutine 分配大小,分配堆栈等。每分配 runtime.MemProfileRate(默认为512K) 个字节进行一次数据采样。
- threadcreate: 获取导致创建 OS 线程的 goroutine 堆栈,查看线程创建信息。
- block: 获取导致阻塞的 goroutine 堆栈(如 channel, mutex 等),使用前需要先调用 runtime.SetBlockProfileRate
- mutex: 获取导致 mutex 争用的 goroutine 堆栈,使用前需要先调用 runtime.SetMutexProfileFraction
以上五个 CMD 都通过runtime/pprof Profile 结构体统一管理,以 Lookup 提供统一查询接口,有相似的返回值(goroutine 堆栈),它们都支持一个 debug URL参数,默认为0,此时返回的采样数据是不可人为解读的函数地址列表,需要结合 pprof 工具才能还原函数名字。 debug=1时,会将函数地址转换为函数名,即脱离 pprof 在浏览器中直接查看。对 goroutine CMD来说,还支持 debug=2,此时将以 unrecovered panic 的格式打印堆栈,可读性更高。如启用net/http/pprof后,http://localhost:6060/debug/pprof/goroutine?debug=2 的响应格式为:
 1
 2
 3
 4
 5
 6
 7
 8
 9
10
11
12
13
14
15
16
17
18
19
20
21
|
goroutine 18 [chan receive, 8 minutes]:
ngs/core/glog.logWorker(0x18b548a, 0x4, 0x7fff5fbffb0e, 0x0, 0x3, 0xc4200e31a0, 0xc4203627c4)
    /Users/wudaijun/go/src/ngs/core/glog/worker.go:43 +0x19c
created by ngs/core/glog.newLogger
    /Users/wudaijun/go/src/ngs/core/glog/glog.go:51 +0xe4

goroutine 6 [syscall, 8 minutes]:
os/signal.signal_recv(0x0)
    /usr/local/Cellar/go/1.9.1/libexec/src/runtime/sigqueue.go:131 +0xa7
os/signal.loop()
    /usr/local/Cellar/go/1.9.1/libexec/src/os/signal/signal_unix.go:22 +0x22
created by os/signal.init.0
    /usr/local/Cellar/go/1.9.1/libexec/src/os/signal/signal_unix.go:28 +0x41

goroutine 50 [select, 8 minutes]:
context.propagateCancel.func1(0x1cfcee0, 0xc42017a1e0, 0x1cf3820, 0xc42005b480)
    /usr/local/Cellar/go/1.9.1/libexec/src/context/context.go:260 +0x113
created by context.propagateCancel
    /usr/local/Cellar/go/1.9.1/libexec/src/context/context.go:259 +0x1da

...
|
以上几种 Profile 可在 http://localhost:6060/debug/pprof/ 中看到,除此之外,go pprof 的 CMD 还包括:
-
cmdline: 获取程序的命令行启动参数
-
profile: 访问这个链接会自动进行 CPU profiling,持续 30s,并生成一个文件供下载。获取指定时间内(从请求时开始)的cpuprof,倒计时结束后自动返回。参数: seconds, 默认值为30。cpuprofile 每秒钟采样100次,收集当前运行的 goroutine 堆栈信息。
-
symbol: 根据传入的程序计数器(PC)的值,获取对应的函数的名称信息,调用了runtime包的FuncForPC获取对应的函数信息。可以传入多个PC值,以加号作为连接符号,比如访问:http://127.0.0.1:8080/debug/pprof/symbol?0x4e667d+0x6ec770, 返回PC值与函数对应名称的信息。用于将地址列表转换为函数名列表,地址通过’+’分隔,如 URL/debug/pprof?0x18d067f+0x17933e7.
-
trace: 对应用程序进行执行追踪,参数: seconds, 默认值1s.此接口用于获取程序执行中的事件跟踪信息,比如协程、系统调用、GC、堆大小改变等事件,大多数事件的跟踪精确度能达到纳秒级别,后端调用了runtime包的StartTrace,会进行一个STW的操作。获取数据的时长默认为1秒,可以通过seconds参数进行修改。先通过以下命令获取数据:
wget http://127.0.0.1:8080/debug/pprof/trace?seconds=10 -O tracefile
然后执行go tool trace tacefile进行数据分析。
这几个 CMD 因为各种原因没有整合到 Profile 结构中去,但就使用上而言,是没有区别的,URL格式是一致的,因此可以看做一个整体,从各个角度对系统进行数据采样和分析。
代码测试
一般 Golang 的性能测试我们会使用 Golang 提供的 Benchmark 功能,Golang 提供了命令行参数我们可以直接得到测试文件中 Benchmark 的 Profiling 数据。不需要添加任何代码。
go test 命令有两个参数和 pprof 相关,它们分别指定生成的 CPU 和 Memory profiling 保存的文件:
- -cpuprofile:cpu profiling 数据要保存的文件地址
- -memprofile:memory profiling 数据要报文的文件地址
比如下面执行测试的同时,也会执行 CPU profiling,并把结果保存在 cpu.prof 文件中:
1
|
go test -bench . -cpuprofile=cpu.prof
|
执行结束之后,就会生成 main.test 和 cpu.prof 文件。要想使用 go tool pprof,需要指定的二进制文件就是 main.test。
go test可以直接加-cpuprofile -mutexprofilefraction等参数实现prof数据的采样和生成,更多相关参数参考 go test -h。
需要注意的是,Profiling 一般和性能测试一起使用,这个原因在前文也提到过,只有应用在负载高的情况下 Profiling 才有意义。
能通过对应的库获取想要的 Profiling 数据之后(不管是文件还是 http),下一步就是要对这些数据进行保存和分析,我们可以使用 go tool pprof 命令行工具。
NOTE:获取的 Profiling 数据是动态的,要想获得有效的数据,请保证应用处于较大的负载(比如正在生成中运行的服务,或者通过其他工具模拟访问压力)。否则如果应用处于空闲状态,得到的结果可能没有任何意义。
CPU Profiling
CPU 分析文件是最常见的配置文件类型,也是最明显的配置文件。
启用 CPU 性能分析后,运行时将每 10 毫秒中断一次,并记录当前正在运行的 goroutine 的堆栈跟踪。
分析文件完成后,我们可以对其进行分析以确定最热门的代码路径。
函数在分析文件中出现的次数越多,代码路径花费的时间就越多。
go tool pprof 最简单的使用方式为 go tool pprof [source],source 表示 profile 数据的来源,可以是本地的文件,也可以是 http 地址。
注意: 如果你已经使用 Go 一段时间了,你可能会被告知pprof有两个参数。从 Go 1.9 开始,profile 文件包含展示 profile 所需的所有信息。你不再需要生成 profile 的二进制文件了。
比如:
1
2
3
4
5
6
|
➜  go tool pprof ./hyperkube http://172.16.3.232:10251/debug/pprof/profile
Fetching profile from http://172.16.3.232:10251/debug/pprof/profile
Please wait... (30s)
Saved profile in /home/cizixs/pprof/pprof.hyperkube.172.16.3.232:10251.samples.cpu.002.pb.gz
Entering interactive mode (type "help" for commands)
(pprof)
|
这个命令会进行 CPU profiling 分析,等待一段时间(默认是 30s,如果在 url 最后加上 ?seconds=60 参数可以调整采集数据的时间为 60s)之后,我们就进入了一个交互式命令行,可以对解析的结果进行查看和导出。可以通过 help 来查看支持的自命令有哪些。
一个有用的命令是 topN,它列出最耗时间的地方:
 1
 2
 3
 4
 5
 6
 7
 8
 9
10
|
(pprof) top5
Showing nodes accounting for 9.60s, 41.20% of 23.30s total
Dropped 112 nodes (cum <= 0.12s)
Showing top 5 nodes out of 90
      flat  flat%   sum%        cum   cum%
     2.59s 11.12% 11.12%      2.78s 11.93%  runtime.mapaccess1_fast64 /usr/local/Cellar/go/1.9.1/libexec/src/runtime/hashmap_fast.go
     2.26s  9.70% 20.82%      4.97s 21.33%  runtime.scanobject /usr/local/Cellar/go/1.9.1/libexec/src/runtime/mgcmark.go
     2.06s  8.84% 29.66%     13.79s 59.18%  main.FindLoops /Users/wudaijun/Code/goprof/havlak/havlak1.go
     1.39s  5.97% 35.62%      1.39s  5.97%  runtime.heapBitsForObject /usr/local/Cellar/go/1.9.1/libexec/src/runtime/mbitmap.go
     1.30s  5.58% 41.20%      4.14s 17.77%  runtime.mapassign_fast64 /usr/local/Cellar/go/1.9.1/libexec/src/runtime/hashmap_fast.go
|
每一行表示一个函数的信息:
- flat:给定函数在 CPU 上的运行耗时,该函数正在运行的次数*采样频率(10ms),即得到估算的函数运行”采样时间”。这里不包括函数等待子函数返回。
- flat%:给定函数在 CPU 上的耗时总比例,flat / 总采样时间值
- sum%:前面所有行的 flat% 的累加值,如第二行 sum% = 20.82% = 11.12% + 9.70%
- cum:当前函数以及子函数的 CPU 运行总耗时,采样时,该函数出现在调用堆栈的采样时间,包括函数等待子函数返回。因此 flat <= cum
- cum%:当前函数以及子函数的 CPU 运行耗时总比例,cum / 总采样时间值
如果应用程序有性能问题,上面这些信息应该能告诉我们时间都花费在哪些函数的执行上了。
go tool pprof 常用命令:
- topN: 输入 top 命令,默认显示 flat 前10的函数调用,可使用 -cum 以 cum 排序
- list Func: 显示函数名以及每行代码的采样分析
- web: 生成 svg 热点图片,可在浏览器中打开,可使用 web Func 来过滤指定函数相关调用树
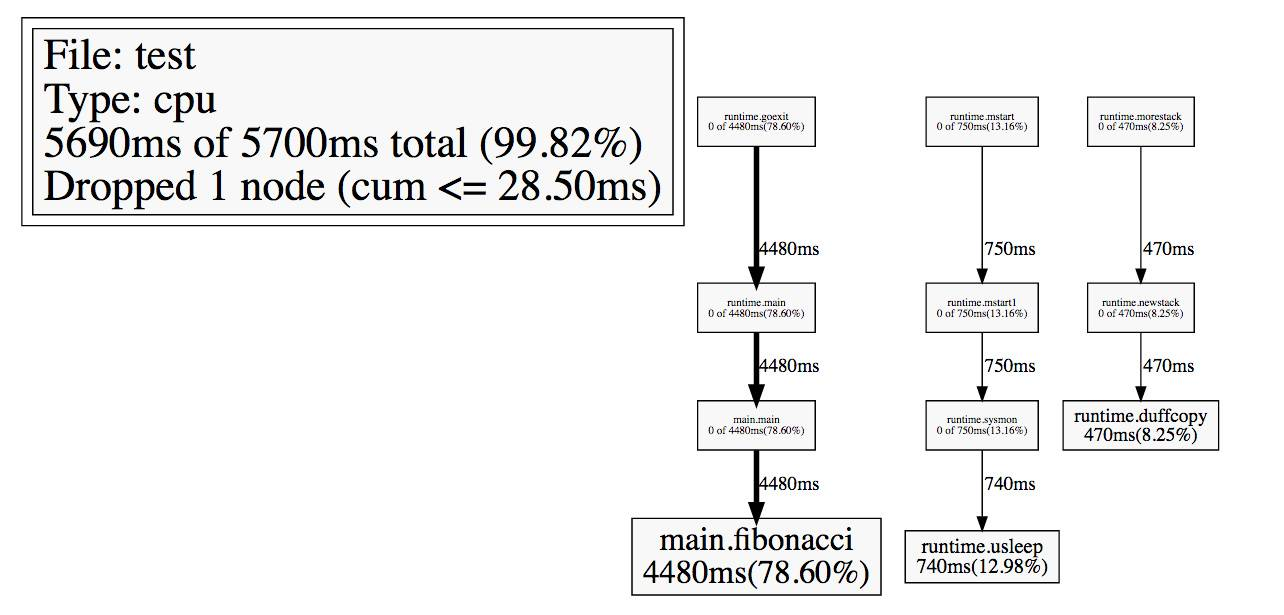
其中一个非常便利的是 web 命令,在交互模式下输入 web,就能自动生成一个 svg 文件,并跳转到浏览器打开,生成了一个函数调用图:
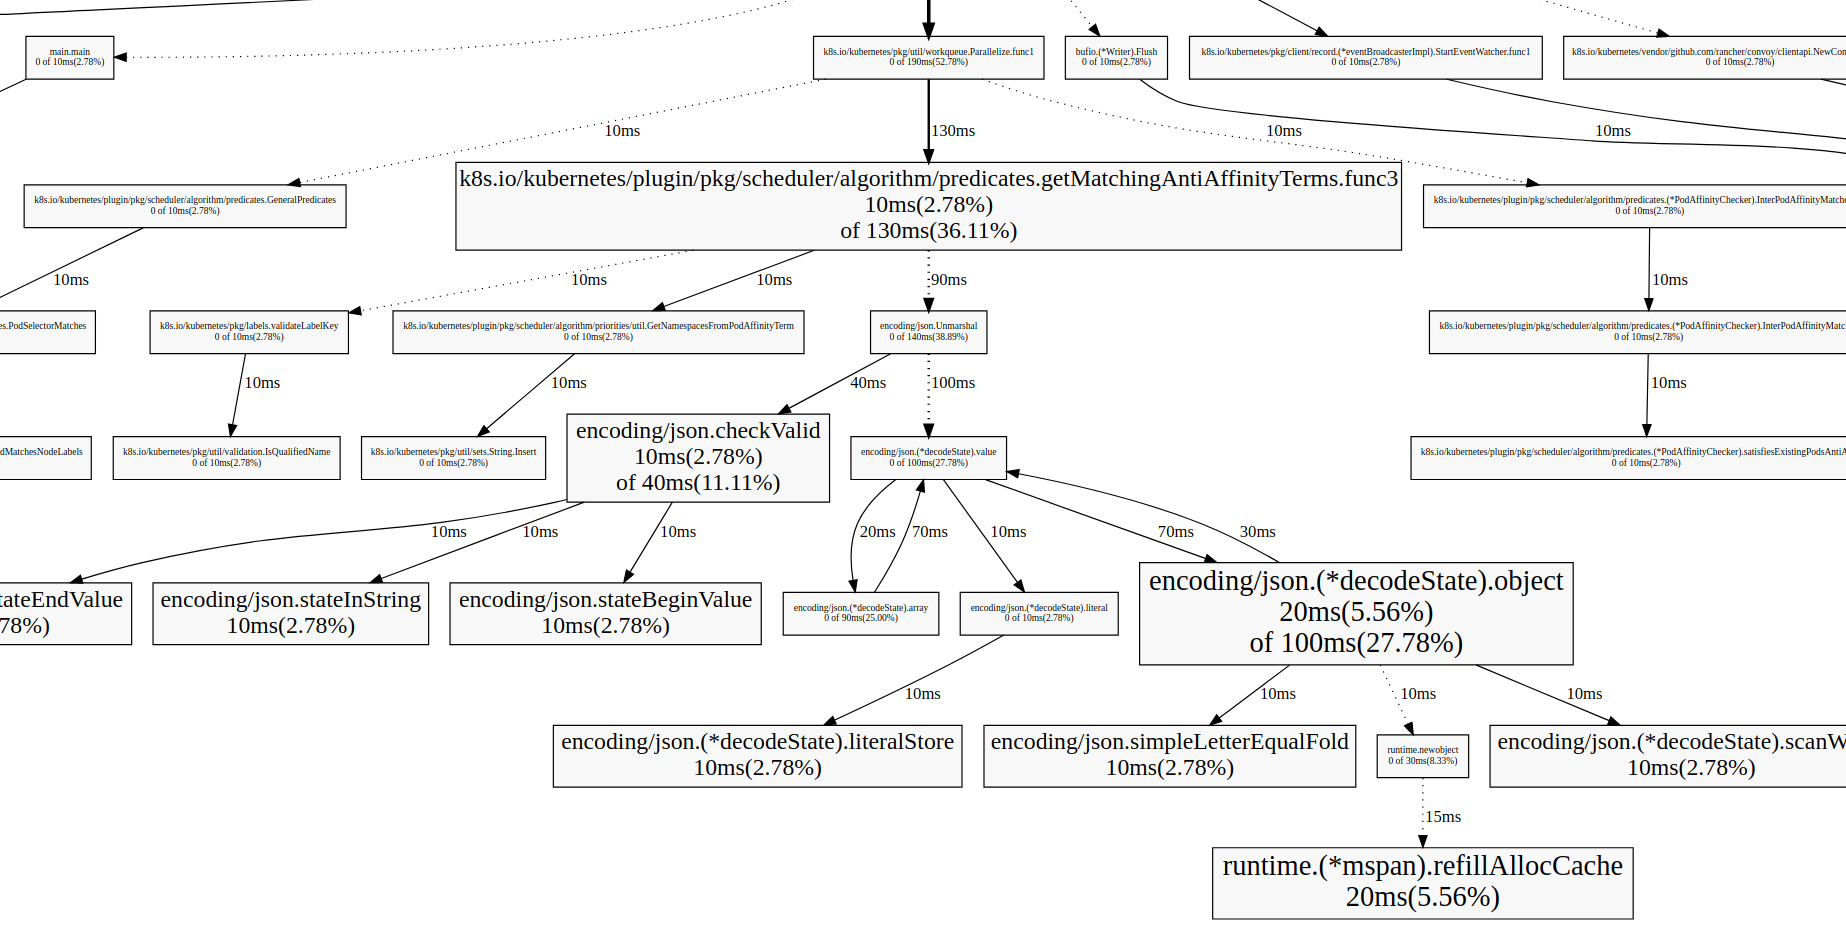
这个调用图包含了更多的信息,而且可视化的图像能让我们更清楚地理解整个应用程序的全貌。
图中的连线代表对方法的调用,连线上的标签代表指定的方法调用的采样值(例如时间、内存分配大小等),方框的大小与方法运行的采样值的大小有关。
每个方框由两个标签组成:在 cpu profile 中,一个是方法运行的时间占比,一个是它在采样的堆栈中出现的时间占比(前者是 flat 时间,后者则是 cumulate 时间占比);框越大,代表耗时越多或是内存分配越多。
要想更细致分析,就要精确到代码级别了,看看每行代码的耗时,直接定位到出现性能问题的那行代码。pprof 也能做到,list 命令后面跟着一个正则表达式,就能查看匹配函数的代码以及每行代码的耗时:
 1
 2
 3
 4
 5
 6
 7
 8
 9
10
11
12
13
14
15
|
(pprof) list podFitsOnNode
Total: 120ms
ROUTINE ======================== k8s.io/kubernetes/plugin/pkg/scheduler.podFitsOnNode in /home/cizixs/go/src/k8s.io/kubernetes/_output/local/go/src/k8s.io/kubernetes/plugin/pkg/scheduler/generic_scheduler.go
         0       20ms (flat, cum) 16.67% of Total
         .          .    230:
         .          .    231:// Checks whether node with a given name and NodeInfo satisfies all predicateFuncs.
         .          .    232:func podFitsOnNode(pod *api.Pod, meta interface{}, info *schedulercache.NodeInfo, predicateFuncs map[string]algorithm.FitPredicate) (bool, []algorithm.PredicateFailureReason, error) {
         .          .    233:    var failedPredicates []algorithm.PredicateFailureReason
         .          .    234:    for _, predicate := range predicateFuncs {
         .       20ms    235:        fit, reasons, err := predicate(pod, meta, info)
         .          .    236:        if err != nil {
         .          .    237:            err := fmt.Errorf("SchedulerPredicates failed due to %v, which is unexpected.", err)
         .          .    238:            return false, []algorithm.PredicateFailureReason{}, err
         .          .    239:        }
         .          .    240:        if !fit {
|
如果想要了解对应的汇编代码,可以使用 disadm <regex> 命令。这两个命令虽然强大,但是在命令行中查看代码并不是很方面,所以你可以使用 weblist 命令,用法和两者一样,但它会在浏览器打开一个页面,能够同时显示源代码和汇编代码。
NOTE:更详细的 pprof 使用方法可以参考 pprof –help 或者 pprof 文档。
Memory Profiling
进行堆分配时,memory profiling 记录堆栈跟踪。
堆栈分配假定为空闲,并且在内存性能分析文件中未跟踪。
像 CPU 分析一样,memory profiling 都是基于样本的,默认情况下,每 1000 个分配中的内存分析样本为 1。 此速率可以更改。
由于 memory profiling 是基于样本的,且它跟踪的是已分配的内存而不是使用中的内存,所以很难使用 memory profiling 来确定应用程序的整体内存使用情况。
个人想法: 我发现 memory profiling 对发现内存泄漏没有帮助。
要想获得内存使用 Profiling 信息,只需要把数据源修改一下就行(对于 http 方式来说就是修改 url 的地址,从 /debug/pprof/profile 改成 /debug/pprof/heap)
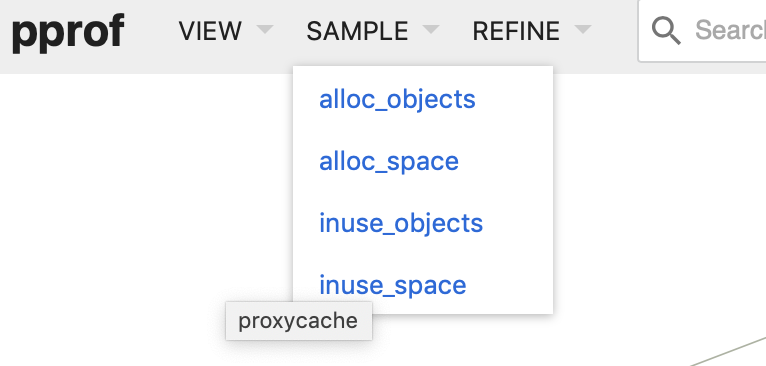
默认情况下,统计的是当前内存使用数(字节数或对象数量),即使用 --inuse_objects 。
除此之外,我们还可以使用 --alloc-space 来查看和分析当前截止每当前时刻已分配内存的总和(字节数或对象数量),比如每次为一个 struct 分配一块新内存空间,都会计数在内(即使在分配之后,马上被 GC 回收了。而前者来说,就会考虑)。
有两种内存分析策略:一种是当前的(这一次采集)内存或对象的分配,称为 inuse;另一种是从程序运行到现在所有的内存分配,不管是否已经被 gc 过了,称为 alloc。
| Name |
Meaning |
| inuse_space |
已分配但尚未释放的内存量 |
| inuse_objects |
已分配但尚未释放的对象数量 |
| alloc_space |
分配的内存总量(不考虑释放) |
| alloc_objects |
分配的对象总数(无论是否释放) |
进入http://127.0.0.1:8080/debug/pprof/heap?debug=1 可以查看具体的显示:
 1
 2
 3
 4
 5
 6
 7
 8
 9
10
11
12
13
14
15
16
17
18
19
20
21
22
23
24
25
26
27
28
29
30
31
32
33
34
35
36
|
heap profile: 3190: 77516056 [54762: 612664248] @ heap/1048576
1: 29081600 [1: 29081600] @ 0x89368e 0x894cd9 0x8a5a9d 0x8a9b7c 0x8af578 0x8b4441 0x8b4c6d 0x8b8504 0x8b2bc3 0x45b1c1
#    0x89368d    github.com/syndtr/goleveldb/leveldb/memdb.(*DB).Put+0x59d
#    0x894cd8    xxxxx/storage/internal/memtable.(*MemTable).Set+0x88
#    0x8a5a9c    xxxxx/storage.(*snapshotter).AppendCommitLog+0x1cc
#    0x8a9b7b    xxxxx/storage.(*store).Update+0x26b
#    0x8af577    xxxxx/config.(*config).Update+0xa7
#    0x8b4440    xxxxx/naming.(*naming).update+0x120
#    0x8b4c6c    xxxxx/naming.(*naming).instanceTimeout+0x27c
#    0x8b8503    xxxxx/naming.(*naming).(xxxxx/naming.instanceTimeout)-fm+0x63

......

# runtime.MemStats
# Alloc = 2463648064
# TotalAlloc = 31707239480
# Sys = 4831318840
# Lookups = 2690464
# Mallocs = 274619648
# Frees = 262711312
# HeapAlloc = 2463648064
# HeapSys = 3877830656
# HeapIdle = 854990848
# HeapInuse = 3022839808
# HeapReleased = 0
# HeapObjects = 11908336
# Stack = 655949824 / 655949824
# MSpan = 63329432 / 72040448
# MCache = 38400 / 49152
# BuckHashSys = 1706593
# GCSys = 170819584
# OtherSys = 52922583
# NextGC = 3570699312
# PauseNs = [1052815 217503 208124 233034 1146462 456882 1098525 530706 551702 419372 768322 596273 387826 455807 563621 587849 416204 599143 572823 488681 701731 656358 2476770 12141392 5827253 3508261 1715582 1295487 908563 788435 718700 0 0 0 0 0 0 0 0 0 0 0 0 0 0 0 0 0 0 0 0 0 0 0 0 0 0 0 0 0 0 0 0 0 0 0 0 0 0 0 0 0 0 0 0 0 0 0 0 0 0 0 0 0 0 0 0 0 0 0 0 0 0 0 0 0 0 0 0 0 0 0 0 0 0 0 0 0 0 0 0 0 0 0 0 0 0 0 0 0 0 0 0 0 0 0 0 0 0 0 0 0 0 0 0 0 0 0 0 0 0 0 0 0 0 0 0 0 0 0 0 0 0 0 0 0 0 0 0 0 0 0 0 0 0 0 0 0 0 0 0 0 0 0 0 0 0 0 0 0 0 0 0 0 0 0 0 0 0 0 0 0 0 0 0 0 0 0 0 0 0 0 0 0 0 0 0 0 0 0 0 0 0 0 0 0 0 0 0 0 0 0 0 0 0 0 0 0 0 0 0 0 0 0 0 0 0 0 0 0 0 0 0 0 0 0 0 0 0 0 0 0 0 0 0 0]
# NumGC = 31
# DebugGC = false
|
其中显示的内容会比较多,但是主体分为2个部分: 第一个部分打印为通过runtime.MemProfile()获取的runtime.MemProfileRecord记录。 其含义为:
1
2
3
|
heap profile: 3190(inused objects): 77516056(inused bytes) [54762(alloc objects): 612664248(alloc bytes)] @ heap/1048576(2*MemProfileRate)
1: 29081600 [1: 29081600] (前面4个数跟第一行的一样,此行以后是每次记录的,后面的地址是记录中的栈指针)@ 0x89368e 0x894cd9 0x8a5a9d 0x8a9b7c 0x8af578 0x8b4441 0x8b4c6d 0x8b8504 0x8b2bc3 0x45b1c1
#    0x89368d    github.com/syndtr/goleveldb/leveldb/memdb.(*DB).Put+0x59d 栈信息
|
第二部分就比较好理解,打印的是通过runtime.ReadMemStats()读取的runtime.MemStats信息。 我们可以重点关注一下
- Sys 进程从系统获得的内存空间,虚拟地址空间。
- HeapAlloc 进程堆内存分配使用的空间,通常是用户new出来的堆对象,包含未被gc掉的。
- HeapSys 进程从系统获得的堆内存,因为golang底层使用TCmalloc机制,会缓存一部分堆内存,虚拟地址空间。
- PauseNs 记录每次gc暂停的时间(纳秒),最多记录256个最新记录。
- NumGC 记录gc发生的次数。
和 CPU Profiling 使用一样,使用 top N 可以打印出使用内存最多的函数列表:
 1
 2
 3
 4
 5
 6
 7
 8
 9
10
11
12
13
14
15
|
(pprof) top
11712.11kB of 14785.10kB total (79.22%)
Dropped 580 nodes (cum <= 73.92kB)
Showing top 10 nodes out of 146 (cum >= 512.31kB)
      flat  flat%   sum%        cum   cum%
 2072.09kB 14.01% 14.01%  2072.09kB 14.01%  k8s.io/kubernetes/vendor/github.com/beorn7/perks/quantile.NewTargeted
 2049.25kB 13.86% 27.87%  2049.25kB 13.86%  k8s.io/kubernetes/pkg/api/v1.(*ResourceRequirements).Unmarshal
 1572.28kB 10.63% 38.51%  1572.28kB 10.63%  k8s.io/kubernetes/vendor/github.com/beorn7/perks/quantile.(*stream).merge
 1571.34kB 10.63% 49.14%  1571.34kB 10.63%  regexp.(*bitState).reset
 1184.27kB  8.01% 57.15%  1184.27kB  8.01%  bytes.makeSlice
 1024.16kB  6.93% 64.07%  1024.16kB  6.93%  k8s.io/kubernetes/pkg/api/v1.(*ObjectMeta).Unmarshal
  613.99kB  4.15% 68.23%  2150.63kB 14.55%  k8s.io/kubernetes/pkg/api/v1.(*PersistentVolumeClaimList).Unmarshal
  591.75kB  4.00% 72.23%  1103.79kB  7.47%  reflect.Value.call
  520.67kB  3.52% 75.75%   520.67kB  3.52%  k8s.io/kubernetes/vendor/github.com/gogo/protobuf/proto.RegisterType
  512.31kB  3.47% 79.22%   512.31kB  3.47%  k8s.io/kubernetes/pkg/api/v1.(*PersistentVolumeClaimStatus).Unmarshal
|
每一列的含义也是类似的,只不过从 CPU 使用时间变成了内存使用大小,就不多解释了。
类似的,web 命令也能生成 svg 图片在浏览器中打开,从中可以看到函数调用关系,以及每个函数的内存使用多少。
需要注意的是,默认情况下,统计的是内存使用大小,如果执行命令的时候加上不同的参数,可以统计不同的数值:
加上 -sample_index 参数后(也可以不加),可以切换内存分析的类型:
1
|
go tool pprof -sample_index=alloc_space http://47.93.238.9:8080/debug/pprof/heap
|
- –alloc_objects: 分析应用程序的内存临时分配情况.分配的堆对象个数
- –alloc_space: 查看应用程序分配的内存空间大小.分配的堆内存大小
- –inuse_space: 分析应用程序的常驻内存占用情况
- –inuse_objects: 可以查看每个函数使用的堆对象的个数
这里还要提两个比较有用的方法,如果应用比较复杂,生成的调用图特别大,看起来很乱,有两个办法可以优化:
- 使用 web funcName 的方式,只打印和某个函数相关的内容
- 运行 go tool pprof 命令时加上 –nodefration=0.05 参数,表示如果调用的子函数使用的 CPU、memory 不超过 5%,就忽略它,不要显示在图片中
消耗较多内存可能为以下情况:
- 初始化一个占用较大内存块的对象或多个对象(且他们占用的总内存交大),且初始化后不释放
- 程序运行占用较大的内存,可以通过 inuse_space 来体现
- 不断在初始化多个对象,且占用较多的内存,可以通过 inuse_objects 和 alloc_objects 来体现
- 存在非常频繁的 GC 活动,通常意味着 alloc_space 非常高,而程序运行过程中并没有消耗太多的内存(体现为 inuse_space 并不高)
- 内存泄漏,通常 alloc_space 较高,且 inuse_space 也较高
举例
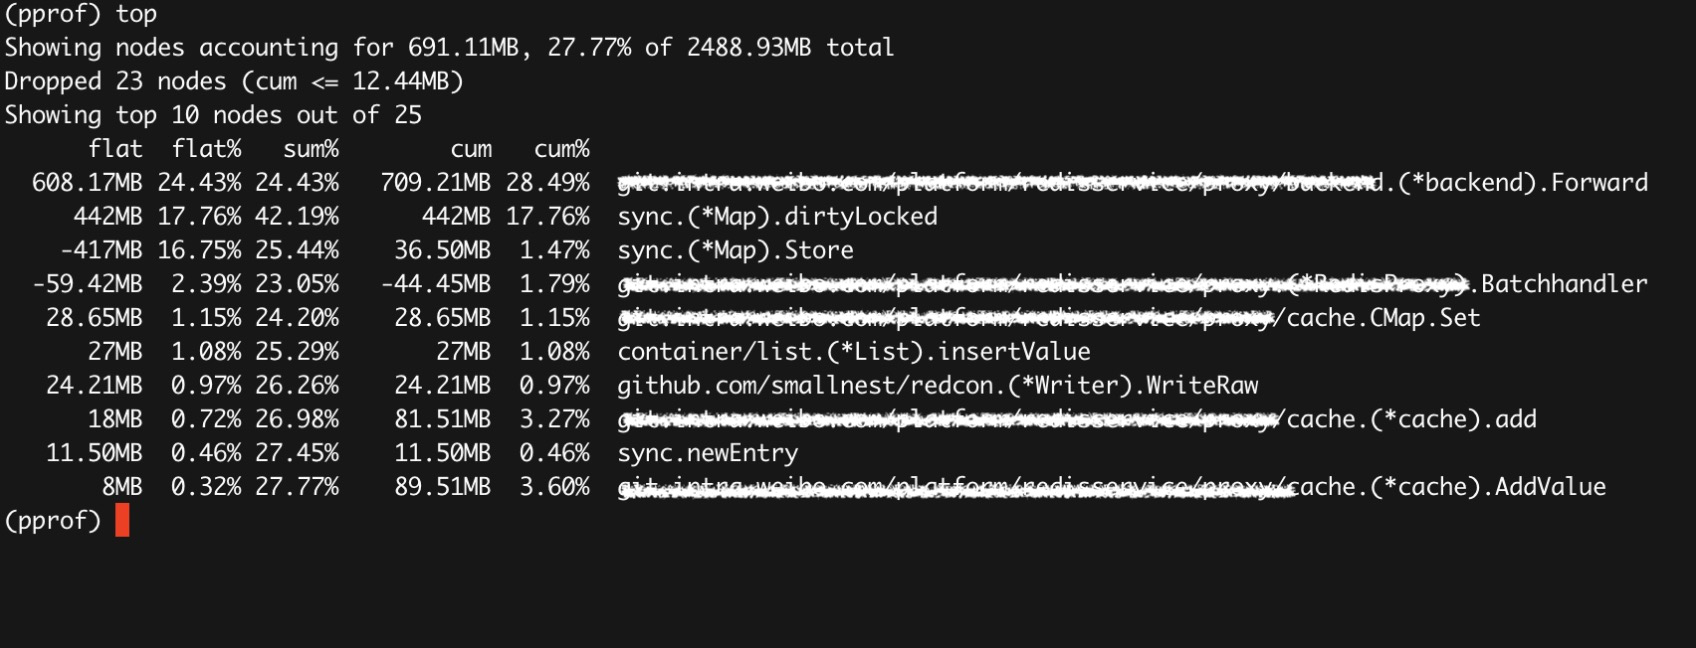
我们可以采用go tool pprof -inuse_space http://127.0.0.1:8080/debug/pprof/heap 命令连接到进程中,查看正在使用的一些内存相关信息,此时我们得到一个可以交互的命令行。
我们可以看数据top10来查看正在使用的对象较多的10个函数入口。通常用来检测有没有不符合预期的内存 对象引用。
 1
 2
 3
 4
 5
 6
 7
 8
 9
10
11
12
13
14
15
|
(pprof) top10
1355.47MB of 1436.26MB total (94.38%)
Dropped 371 nodes (cum <= 7.18MB)
Showing top 10 nodes out of 61 (cum >= 23.50MB)
      flat  flat%   sum%        cum   cum%
  512.96MB 35.71% 35.71%   512.96MB 35.71%  net/http.newBufioWriterSize
  503.93MB 35.09% 70.80%   503.93MB 35.09%  net/http.newBufioReader
  113.04MB  7.87% 78.67%   113.04MB  7.87%  runtime.rawstringtmp
   55.02MB  3.83% 82.50%    55.02MB  3.83%  runtime.malg
   45.01MB  3.13% 85.64%    45.01MB  3.13%  xxxxx/storage.(*Node).clone
   26.50MB  1.85% 87.48%    52.50MB  3.66%  context.WithCancel
   25.50MB  1.78% 89.26%    83.58MB  5.82%  runtime.systemstack
   25.01MB  1.74% 91.00%    58.51MB  4.07%  net/http.readRequest
      25MB  1.74% 92.74%    29.03MB  2.02%  runtime.mapassign
   23.50MB  1.64% 94.38%    23.50MB  1.64%  net/http.(*Server).newConn
|
然后我们用go tool pprof -alloc_space http://127.0.0.1:8080/debug/pprof/heap 命令连接程序来查看内存对象分配的相关情况。然后输入top来查看累积分配内存较多的一些函数调用:
 1
 2
 3
 4
 5
 6
 7
 8
 9
10
11
12
13
14
15
|
(pprof) top
523.38GB of 650.90GB total (80.41%)
Dropped 342 nodes (cum <= 3.25GB)
Showing top 10 nodes out of 106 (cum >= 28.02GB)
      flat  flat%   sum%        cum   cum%
  147.59GB 22.68% 22.68%   147.59GB 22.68%  runtime.rawstringtmp
  129.23GB 19.85% 42.53%   129.24GB 19.86%  runtime.mapassign
   48.23GB  7.41% 49.94%    48.23GB  7.41%  bytes.makeSlice
   46.25GB  7.11% 57.05%    71.06GB 10.92%  encoding/json.Unmarshal
   31.41GB  4.83% 61.87%   113.86GB 17.49%  net/http.readRequest
   30.55GB  4.69% 66.57%   171.20GB 26.30%  net/http.(*conn).readRequest
   22.95GB  3.53% 70.09%    22.95GB  3.53%  net/url.parse
   22.70GB  3.49% 73.58%    22.70GB  3.49%  runtime.stringtoslicebyte
   22.70GB  3.49% 77.07%    22.70GB  3.49%  runtime.makemap
   21.75GB  3.34% 80.41%    28.02GB  4.31%  context.WithCancel
|
可以看出string-[]byte相互转换、分配map、bytes.makeSlice、encoding/json.Unmarshal等调用累积分配的内存较多。 此时我们就可以review代码,如何减少这些相关的调用,或者优化相关代码逻辑。
当我们不明确这些调用时是被哪些函数引起的时,我们可以输入top -cum来查找,-cum的意思就是,将函数调用关系 中的数据进行累积,比如A函数调用的B函数,则B函数中的内存分配量也会累积到A上面,这样就可以很容易的找出调用链。
 1
 2
 3
 4
 5
 6
 7
 8
 9
10
11
12
13
14
15
16
17
18
19
20
21
22
23
24
25
|
(pprof) top20 -cum
322890.40MB of 666518.53MB total (48.44%)
Dropped 342 nodes (cum <= 3332.59MB)
Showing top 20 nodes out of 106 (cum >= 122316.23MB)
      flat  flat%   sum%        cum   cum%
         0     0%     0% 643525.16MB 96.55%  runtime.goexit
 2184.63MB  0.33%  0.33% 620745.26MB 93.13%  net/http.(*conn).serve
         0     0%  0.33% 435300.50MB 65.31%  xxxxx/api/server.(*HTTPServer).ServeHTTP
 5865.22MB  0.88%  1.21% 435300.50MB 65.31%  xxxxx/api/server/router.(*httpRouter).ServeHTTP
         0     0%  1.21% 433121.39MB 64.98%  net/http.serverHandler.ServeHTTP
         0     0%  1.21% 430456.29MB 64.58%  xxxxx/api/server/filter.(*chain).Next
   43.50MB 0.0065%  1.21% 429469.71MB 64.43%  xxxxx/api/server/filter.TransURLTov1
         0     0%  1.21% 346440.39MB 51.98%  xxxxx/api/server/filter.Role30x
31283.56MB  4.69%  5.91% 175309.48MB 26.30%  net/http.(*conn).readRequest
         0     0%  5.91% 153589.85MB 23.04%  github.com/julienschmidt/httprouter.(*Router).ServeHTTP
         0     0%  5.91% 153589.85MB 23.04%  github.com/julienschmidt/httprouter.(*Router).ServeHTTP-fm
         0     0%  5.91% 153540.85MB 23.04%  xxxxx/api/server/router.(*httpRouter).Register.func1
       2MB 0.0003%  5.91% 153117.78MB 22.97%  xxxxx/api/server/filter.Validate
151134.52MB 22.68% 28.58% 151135.02MB 22.68%  runtime.rawstringtmp
         0     0% 28.58% 150714.90MB 22.61%  xxxxx/api/server/router/naming/v1.(*serviceRouter).(git.intra.weibo.com/platform/vintage/api/server/router/naming/v1.service)-fm
         0     0% 28.58% 150714.90MB 22.61%  xxxxx/api/server/router/naming/v1.(*serviceRouter).service
         0     0% 28.58% 141200.76MB 21.18%  net/http.Redirect
132334.96MB 19.85% 48.44% 132342.95MB 19.86%  runtime.mapassign
      42MB 0.0063% 48.44% 125834.16MB 18.88%  xxxxx/api/server/router/naming/v1.heartbeat
         0     0% 48.44% 122316.23MB 18.35%  xxxxxx/config.(*config).Lookup
|
如上所示,我们就很容易的查找到这些函数是被哪些函数调用的。
根据代码的调用关系,filter.TransURLTov1会调用filter.Role30x,但是他们之间的cum%差值有12.45%,因此 我们可以得知filter.TransURLTov1内部自己直接分配的内存量达到了整个进程分配内存总量的12.45%,这可是一个 值得大大优化的地方。
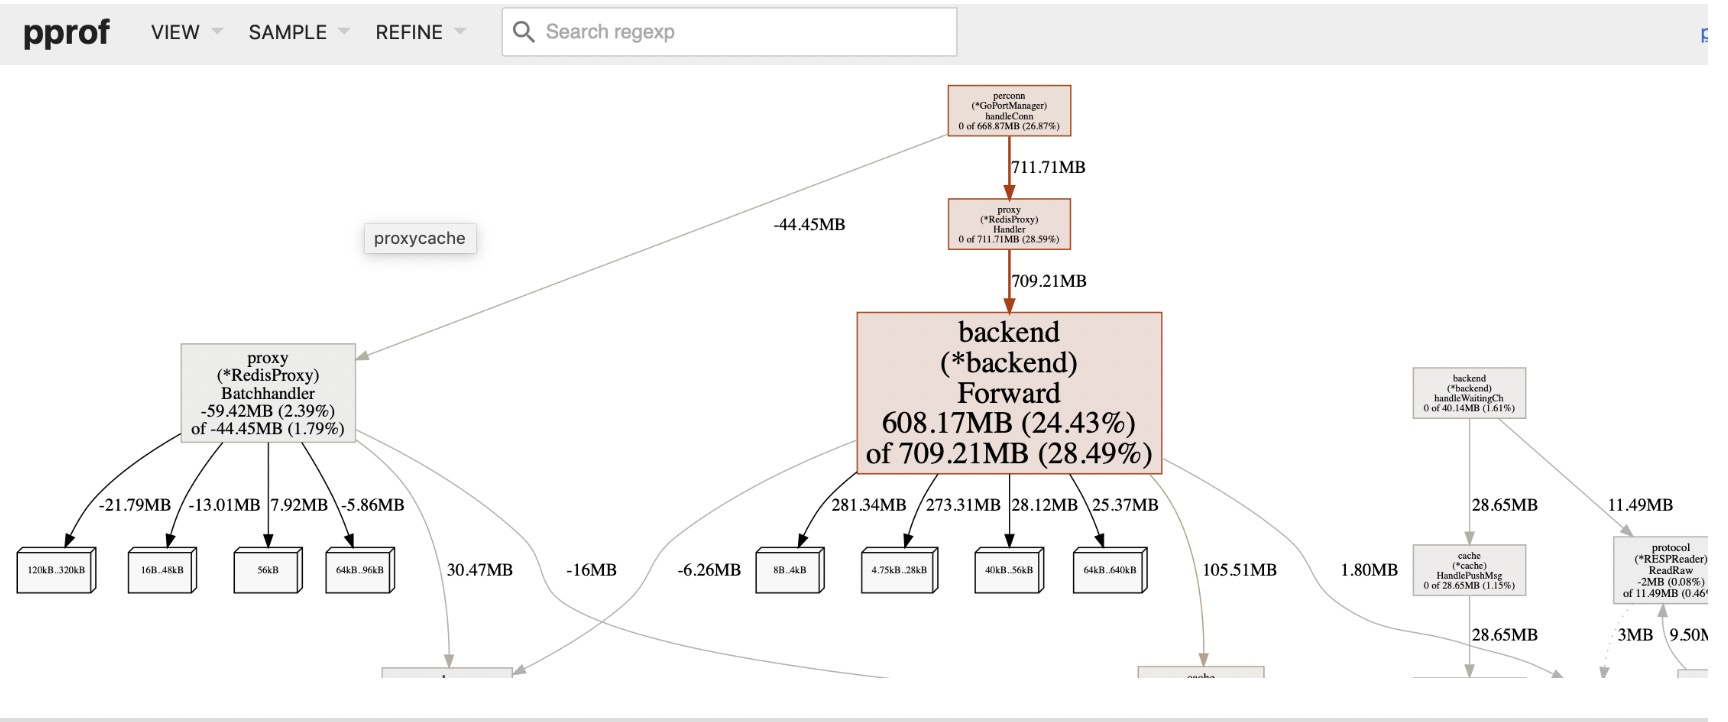
然后我们可以输入命令web,其会给我们的浏览器弹出一个.svg图片,其会把这些累积关系画成一个拓扑图,提供给 我们。或者直接执行go tool pprof -alloc_space -cum -svg http://127.0.0.1:8080/debug/pprof/heap > heap.svg来生成heap.svg图片。
下面我们取一个图片中的一个片段进行分析:
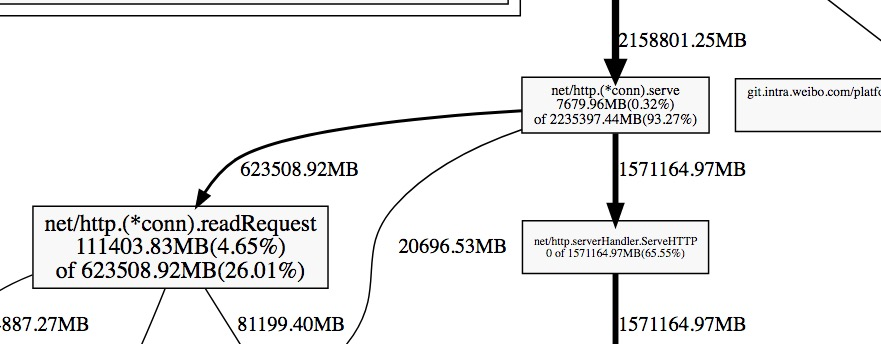
每一个方块为pprof记录的一个函数调用栈,指向方块的箭头上的数字是记录的该栈累积分配的内存向,从方块指出的 箭头上的数字为该函数调用的其他函数累积分配的内存。他们之间的差值可以简单理解为本函数除调用其他函数外,自身分配的。方块内部的数字也体现了这一点,其数字为:(自身分配的内存 of 该函数累积分配的内存)。
举例2
Demo 1 - 内存使用巨头(不释放)
 1
 2
 3
 4
 5
 6
 7
 8
 9
10
11
12
13
14
15
16
17
18
19
20
21
22
23
24
25
26
27
28
29
30
31
32
33
34
35
36
|
package main

import (
	"net/http"
	_ "net/http/pprof"
)

const (
	KB = 1024
	MB = 1024 * KB
	GB = 1024 * MB
)

type StupidStruct struct {
	buffer [][MB]byte
}

var m = StupidStruct{}

func main() {
	go func() {

		stupidMemoryUse()

	}()

	http.ListenAndServe("0.0.0.0:6060", nil)
}

func stupidMemoryUse() {

	max := GB
	for len(m.buffer)*MB < max {
		m.buffer = append(m.buffer, [MB]byte{})
	}
}
|
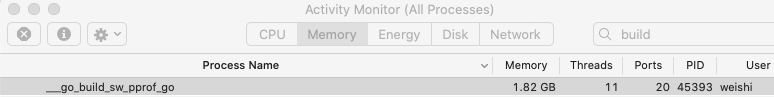
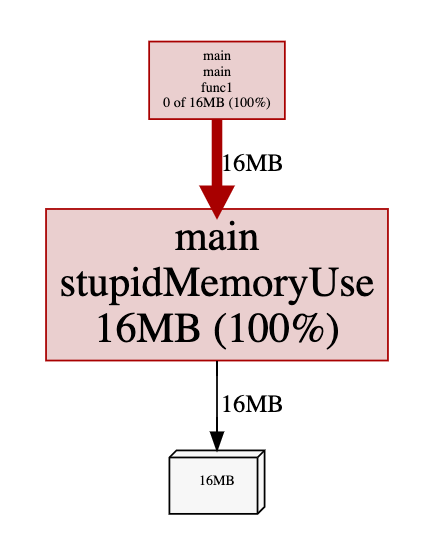
我们来看一个简单的例子,m 中会持有一个内存占用为 1G 的 array,且当内存占用达到 1G 时,不释放任何空间。
inuse_space
可以看到,确实占用了 1G 内存,而且不会去释放:
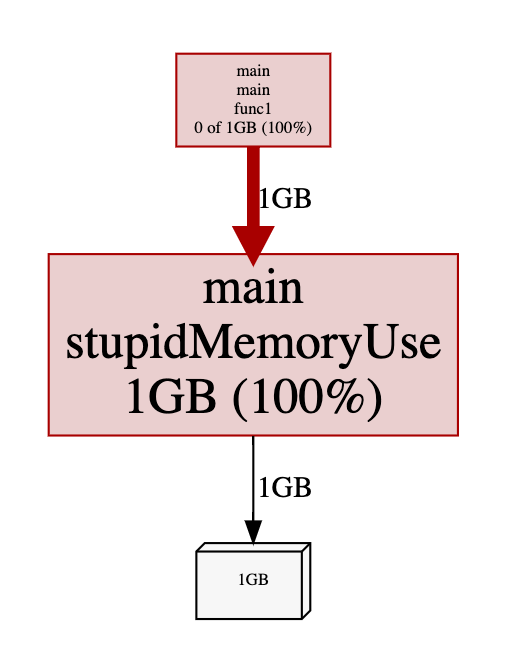
问题代码定位:
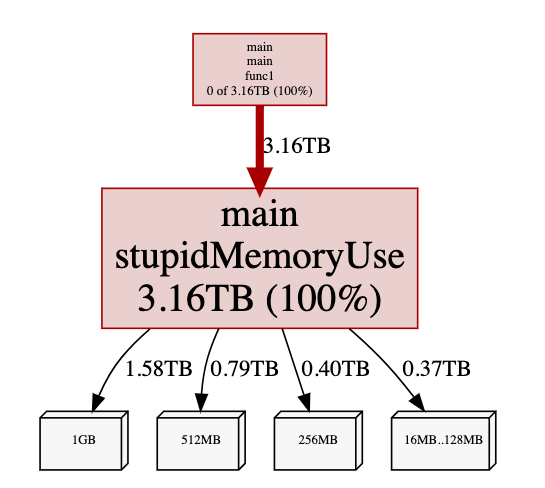
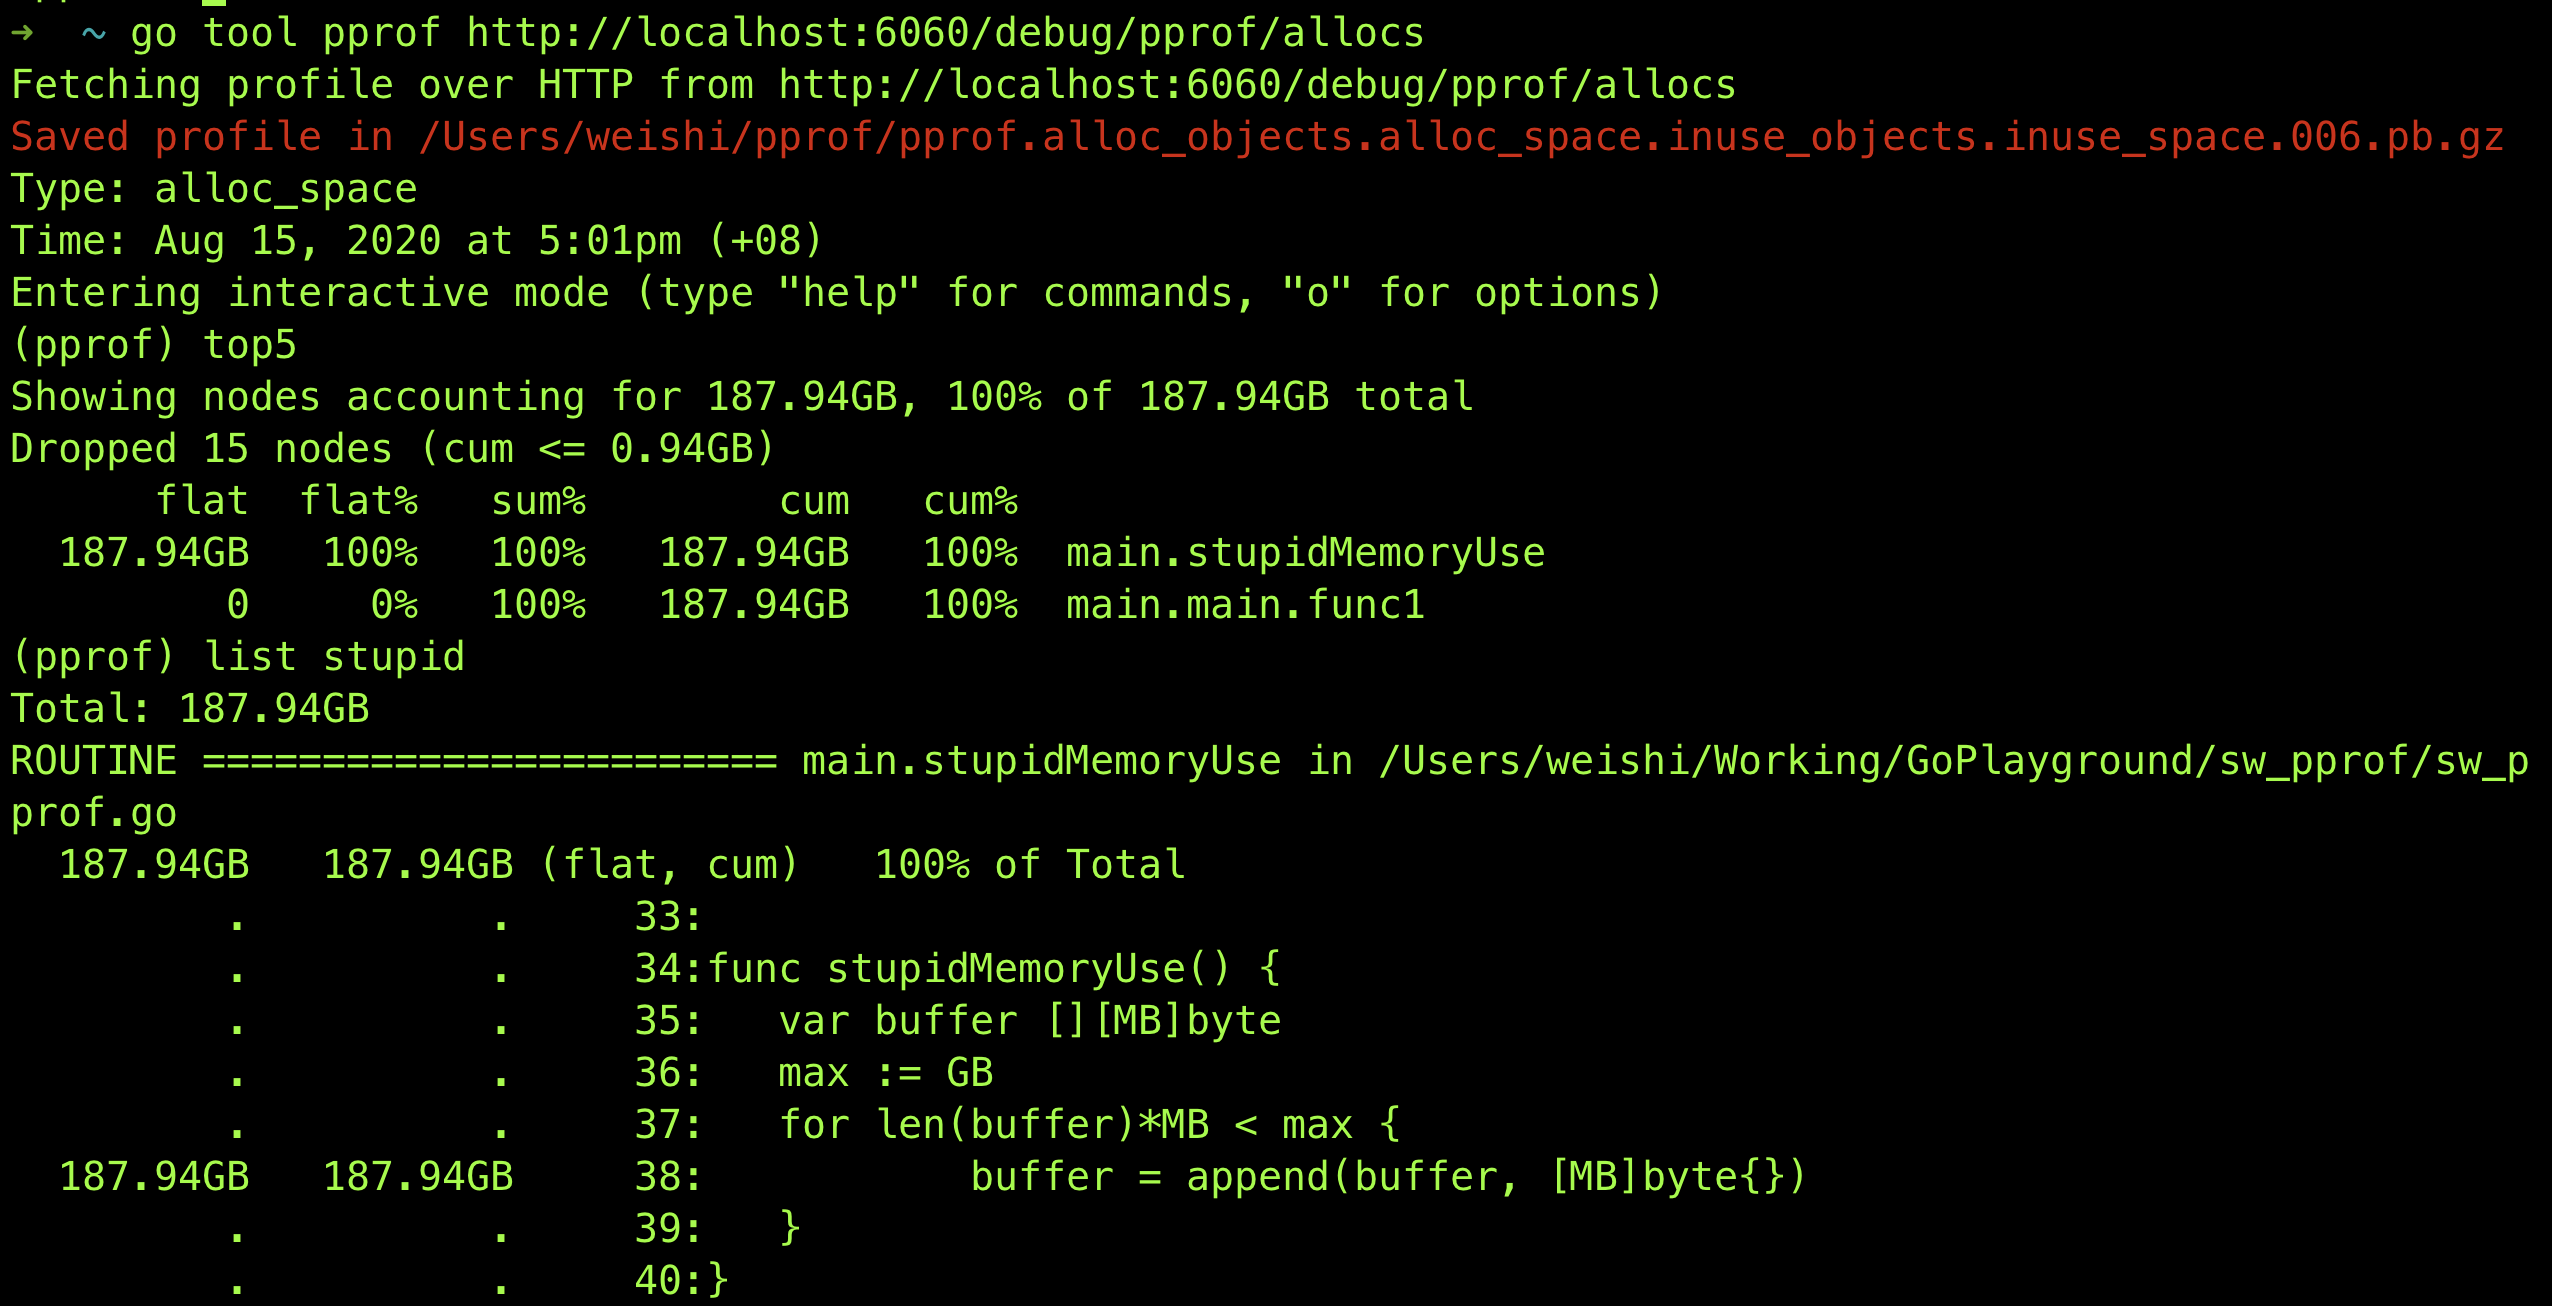
alloc_space
alloc_space 为 2G(> 1G),是因为我们在 append 的过程中,会需要不断的重新分配新的内存区域,因为 > 1G。
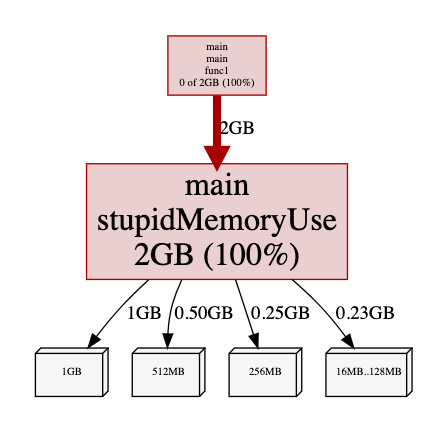
对其进行 CPU Profiling 也能看出来存在频繁的内存空间移动和 GC:
 1
 2
 3
 4
 5
 6
 7
 8
 9
10
11
12
13
14
|
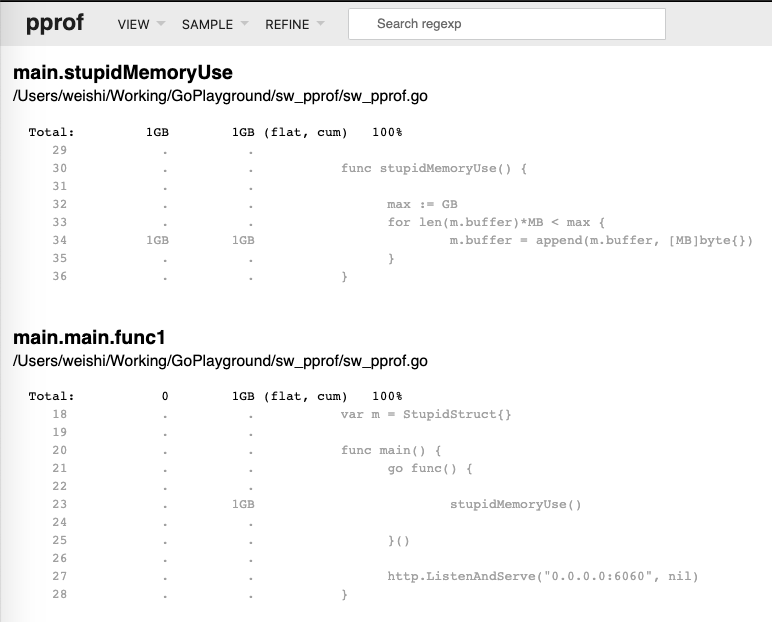
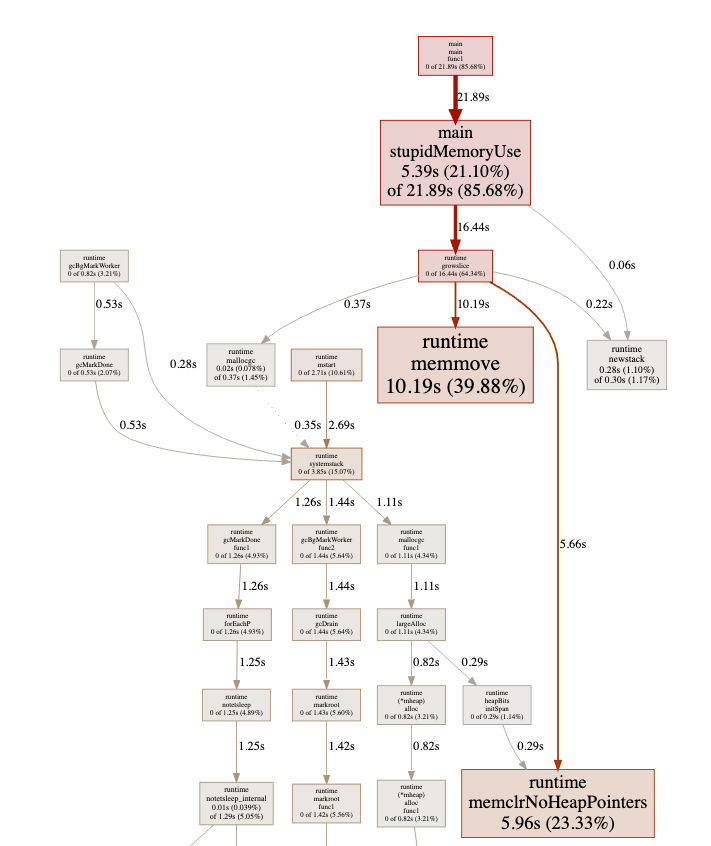
$ go tool pprof http://localhost:6060/debug/pprof/heap
Fetching profile over HTTP from http://localhost:6060/debug/pprof/heap
Saved profile in /Users/weishi/pprof/pprof.alloc_objects.alloc_space.inuse_objects.inuse_space.001.pb.gz
Type: inuse_space
Time: Aug 15, 2020 at 1:47pm (+08)
Entering interactive mode (type "help" for commands, "o" for options)
(pprof) top
Showing nodes accounting for 916.99MB, 100% of 916.99MB total
flat flat% sum% cum cum%
916.99MB 100% 100% 916.99MB 100% GoPlayground/sw_pprof/data.Add
0 0% 100% 916.99MB 100% main.main.func1
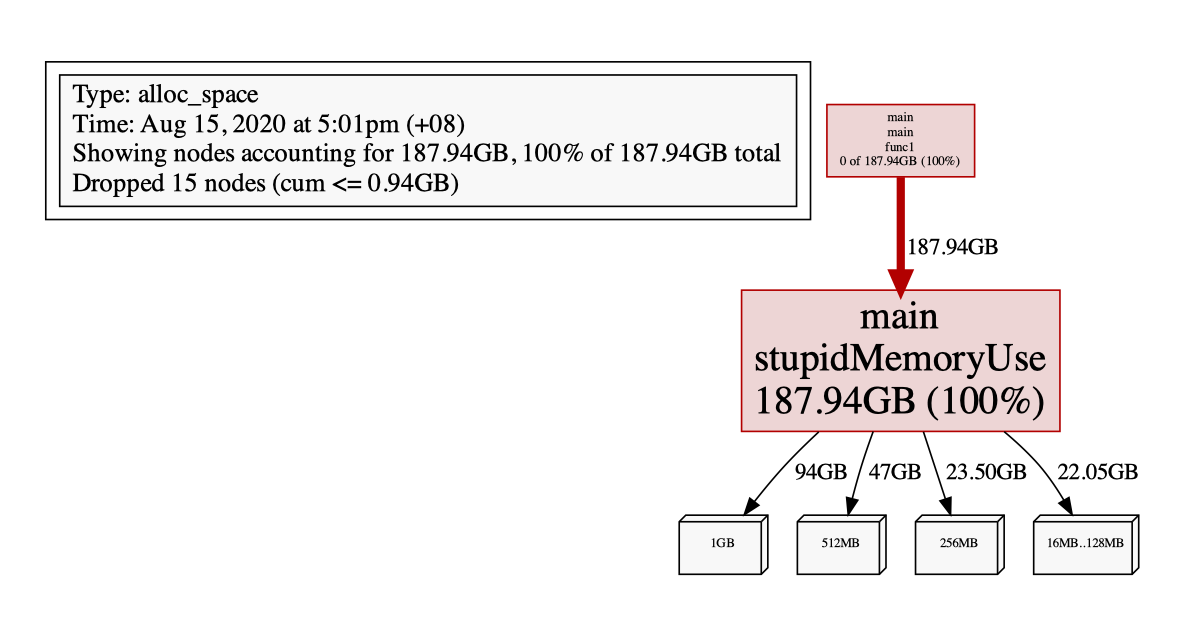
(pprof) pdf
Generating report in profile003.pdf
(pprof)
|
Demo 2 - 频繁 GC
以下是一个不断向 buffer 里追加长度为 1 MiB 的数组,直到总容量到达 1 GiB 为止,然后不断做这个循环的例子:
 1
 2
 3
 4
 5
 6
 7
 8
 9
10
11
12
13
14
15
16
17
18
19
20
21
22
23
24
25
26
27
28
29
30
|
package main

import (
	"net/http"
	_ "net/http/pprof"
)

const (
	KB = 1024
	MB = 1024 *KB
GB = 1024* MB
)

func main() {
	go func() {
		for {
			stupidMemoryUse()
		}
	}()

	http.ListenAndServe("0.0.0.0:6060", nil)
}

func stupidMemoryUse() {
	var buffer [][MB]byte
	max := GB
	for len(buffer)*MB < max {
		buffer = append(buffer, [MB]byte{})
	}
}
|
同样,启动该程序后,等待一会儿,然后启动分析。
inuse_space
inuse_space 会比较低(一定 < 1G),因为这取决于采集那一小段过程中触发的内存分配:
alloc_space
alloc_space 就非常夸张了,因为会不断分配内存,当达到 1G 后,就等待 GC 回收,然后不断请求分配内存….
由于来不及进行 GC,程序的实际内存占用会很高,同时 swap memory 也会被很快被吃掉:
同时也需要消耗大量的 CPU 来进行 GC:
Demo 3 - 查看 GC 活动
频繁进行空间申请和回收的代码:
 1
 2
 3
 4
 5
 6
 7
 8
 9
10
11
12
13
14
15
16
17
18
19
20
21
22
23
24
25
26
27
28
29
30
31
32
33
34
35
36
37
38
39
40
|
package main

import (
	"log"
	"net/http"
	_ "net/http/pprof"
	"os"
	"runtime"
)

const (
	KB = 1024
	MB = 1024 * KB
	GB = 1024 * MB
)

func main() {
	log.SetFlags(log.Lshortfile | log.LstdFlags)
	log.SetOutput(os.Stdout)

	runtime.GOMAXPROCS(1)
	runtime.SetMutexProfileFraction(1)
	runtime.SetBlockProfileRate(1)

	go func() {
		for {
			stupidMemoryUse()
		}
	}()

	http.ListenAndServe("0.0.0.0:6060", nil)
}

func stupidMemoryUse() {
	var buffer [][MB]byte
	max := GB
	for len(buffer)*MB < max {
		buffer = append(buffer, [MB]byte{})
	}
}
|
那我们来用 pprof 分析一下:
如果我们改成这样:
1
2
3
|
func stupidMemoryUse() {
	_ = make([]byte, 5*KB)
}
|
重新编译运行,会发现并不会引起频繁 GC,原因是在 Golang 里,对象是使用堆内存还是栈内存,由编译器进行逃逸分析并决定,如果对象不会逃逸,便可使用栈内存。
但有意外,就是对象的尺寸过大时,就还是只能使用堆内存了。
所以这里设置申请较多的空间,就是为了避免编译器直接在栈上分配(因为,如果那样,就不会涉及到 GC 了)。
Block Profiling
block 分析是 Go 特有的。
block profile文件类似于 CPU profile文件,但是它记录 goroutine 等待共享资源所花费的时间。
这对于确定应用程序中的 并发 瓶颈很有用。
块性能分析可以向您显示何时有大量 goroutine 可以 取得进展,但被 阻塞 了。包括阻止
- 在无缓冲的通道上发送或接收。
- 正在发送到完整频道,从空频道接收。
- 试图锁定被另一个 goroutine 锁定的 sync.Mutex。
block分析是一种非常专业的工具,在您确信消除了所有 CPU 和内存使用瓶颈之后,才应该使用它。
 1
 2
 3
 4
 5
 6
 7
 8
 9
10
11
12
13
14
15
16
17
18
19
20
21
22
23
24
25
26
27
28
29
30
31
32
33
34
35
36
37
38
39
40
|
var mutex sync.Mutex
func main() {
    // rate = 1 时, 统计所有的 block event,
    // rate <=0 时,则关闭block profiling
    // rate > 1 时,为 ns 数,阻塞时间t>rate的event 一定会被统计,小于rate则有t/rate 的几率被统计
    // 参考 https://github.com/golang/go/blob/release-branch.go1.9/src/runtime/mprof.go#L397
	runtime.SetBlockProfileRate(1 * 1000 * 1000)
	var wg sync.WaitGroup
	wg.Add(1)
	mutex.Lock()
	go worker(&wg)
	time.Sleep(2*time.Millisecond)
	mutex.Unlock()
	wg.Wait()
	writeProfTo("block", "block.bprof")
}
func worker(wg *sync.WaitGroup) {
	defer wg.Done()
	mutex.Lock()
	time.Sleep(1*time.Millisecond)
	mutex.Unlock()
}
func writeProfTo(name, fn string) {
	p := pprof.Lookup(name)
	if p == nil {
		fmt.Errorf("%s prof not found", name)
		return
	}
	f, err := os.Create(fn)
	if err != nil {
		fmt.Errorf("%v", err.Error())
		return
	}
	defer f.Close()
	err = p.WriteTo(f, 0)
	if err != nil {
		fmt.Errorf("%v", err.Error())
		return
	}
}
|
运行程序并 pprof:
 1
 2
 3
 4
 5
 6
 7
 8
 9
10
11
|
▶ go build -o Temp tmp.go
▶ go tool pprof Temp block.bprof
(pprof) top
Showing nodes accounting for 3.37ms, 100% of 3.37ms total
      flat  flat%   sum%        cum   cum%
    2.04ms 60.52% 60.52%     2.04ms 60.52%  sync.(*Mutex).Lock /usr/local/Cellar/go/1.9.1/libexec/src/sync/mutex.go
    1.33ms 39.48%   100%     1.33ms 39.48%  sync.(*WaitGroup).Wait /usr/local/Cellar/go/1.9.1/libexec/src/sync/waitgroup.go
         0     0%   100%     1.33ms 39.48%  main.main /Users/wudaijun/go/src/ngs/test/tmp/tmp.go
         0     0%   100%     2.04ms 60.52%  main.worker /Users/wudaijun/go/src/ngs/test/tmp/tmp.go
         0     0%   100%     3.37ms   100%  runtime.goexit /usr/local/Cellar/go/1.9.1/libexec/src/runtime/asm_amd64.s
         0     0%   100%     1.33ms 39.48%  runtime.main /usr/local/Cellar/go/1.9.1/libexec/src/runtime/proc.go
|
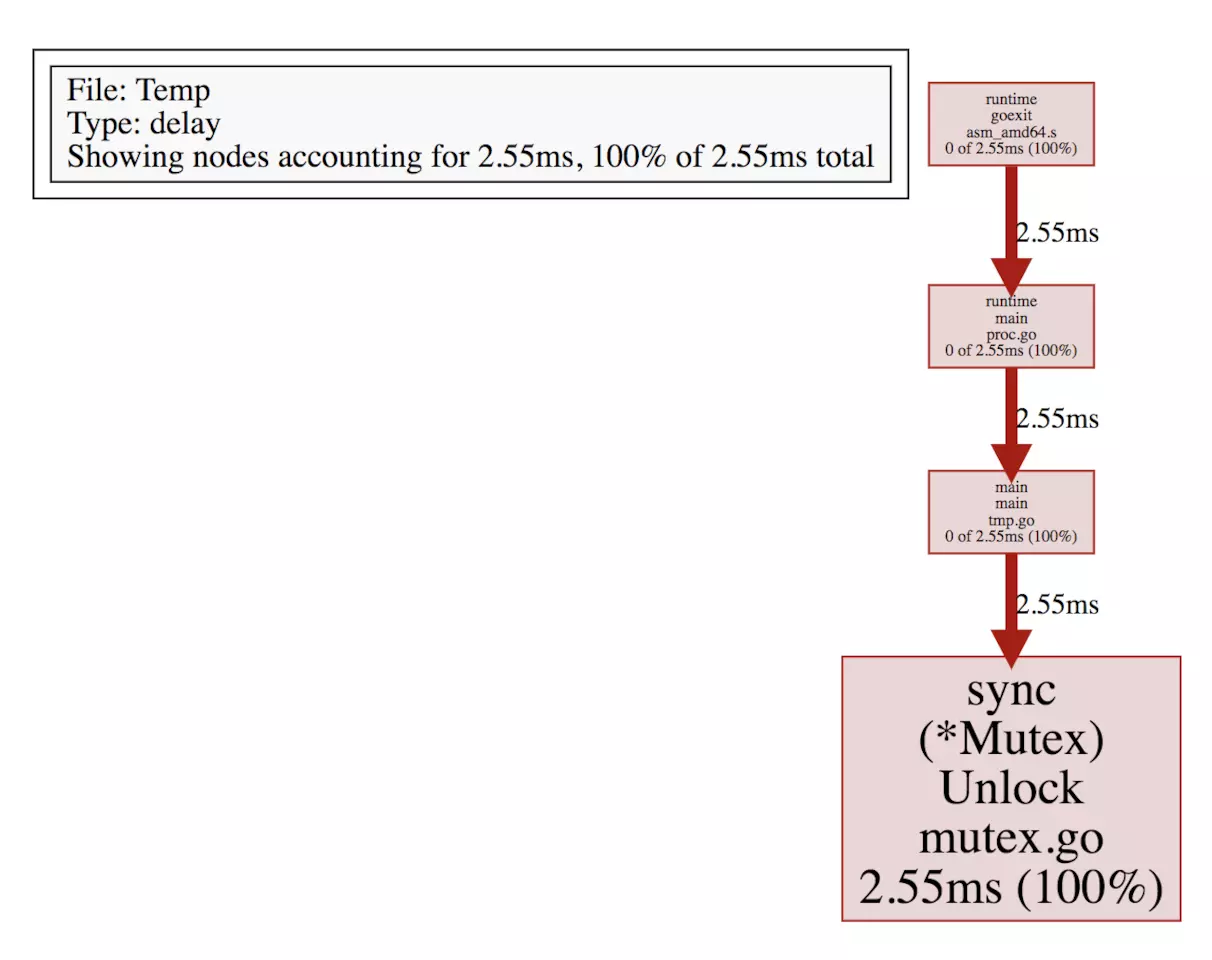
可以看到程序在 mutex.Lock 上阻塞了2.04ms(worker goroutine), 在 WaitGroup.Wait 上等待了1.33ms(main goroutine),从更上层来看,在 main 函数中一共阻塞了2.04ms,worker函数中阻塞了1.33ms(cum 列),通过 web命令生成 svg 图片在浏览器查看:
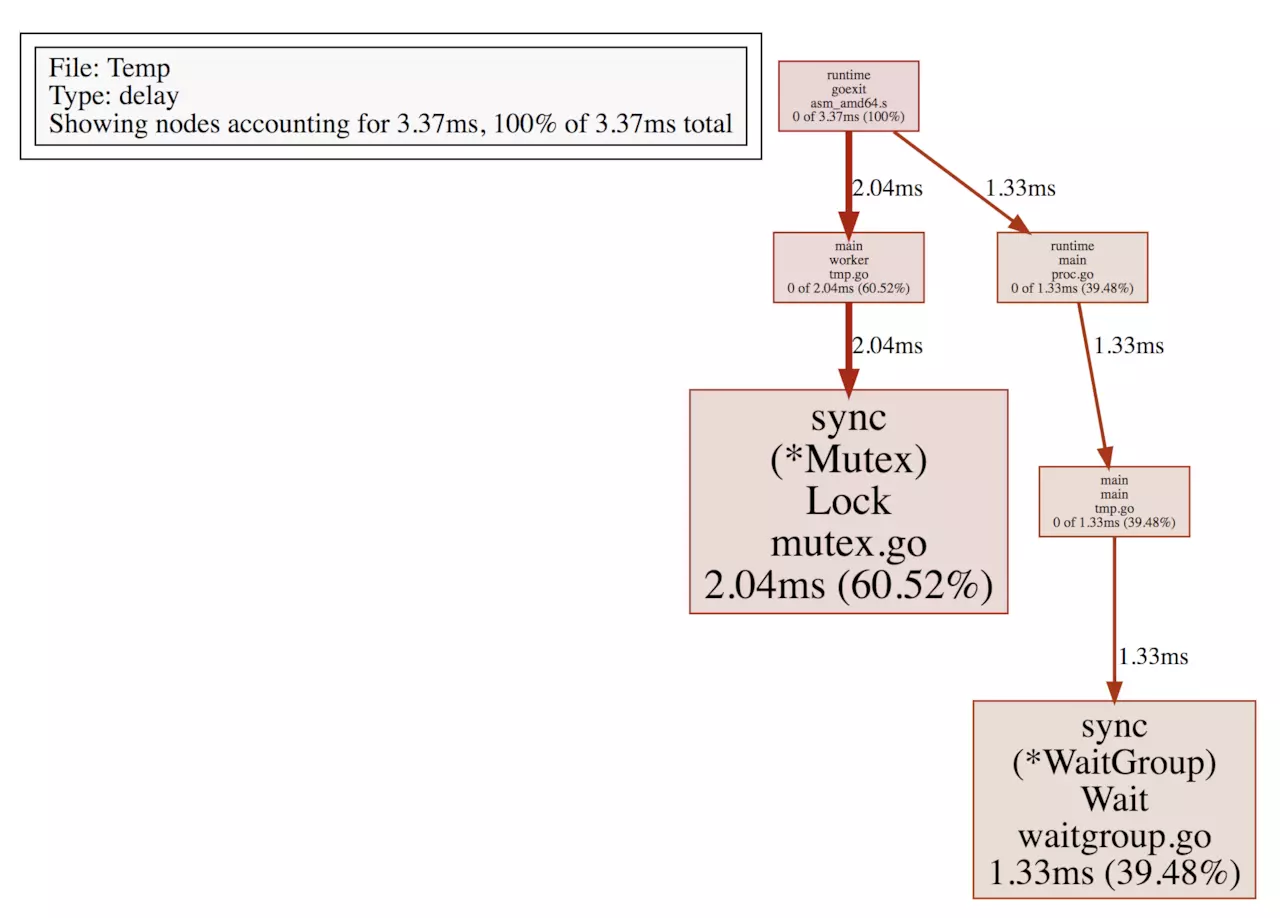
可以很直观地看到整个阻塞调用链,对于耗时较多的阻塞调用加以优化。
Mutex Profiling
互斥锁概要分析与block概要分析类似,但专门针对导致互斥锁争用导致延迟的操作。
仍然用Block Profiling中的代码,只需要改两个地方,将 runtime.SetBlockProfileRate(1 1000 1000) 改为:
1
2
3
4
|
// 当 rate = 0 时,关闭 mutex prof (默认值)
// 当 rate = 1 时,表示记录所有的 mutex event
// 当 rate > 1 时,记录 1/rate 的 mutex event(随机)
runtime.SetMutexProfileFraction(1)
|
再将writeProfTo(“block”, “block.bprof”)改为writeProfTo(“mutex”, “mutex.mprof”)即可,编译运行,并打开 pprof 工具:
1
2
3
4
5
6
7
8
|
▶ go tool pprof bin/Temp mutex.mprof
(pprof) top
Showing nodes accounting for 2.55ms, 100% of 2.55ms total
      flat  flat%   sum%        cum   cum%
    2.55ms   100%   100%     2.55ms   100%  sync.(*Mutex).Unlock /usr/local/Cellar/go/1.9.1/libexec/src/sync/mutex.go
         0     0%   100%     2.55ms   100%  main.main /Users/wudaijun/go/src/ngs/test/tmp/tmp.go
         0     0%   100%     2.55ms   100%  runtime.goexit /usr/local/Cellar/go/1.9.1/libexec/src/runtime/asm_amd64.s
         0     0%   100%     2.55ms   100%  runtime.main /usr/local/Cellar/go/1.9.1/libexec/src/runtime/proc.go
|
查看 svg 图:
可视化界面
从Go 1.11开始,go tool pprof可直接进行可视化界面交互!
1
2
3
|
# This will listen on :8081 and open a browser.
# Change :8081 to a port of your choice.
$ go tool pprof -http=":8081" [binary] [profile]
|
我的golang 版本 v 1.11,所以只执行以下命令:(注意:在执行以下命令过程,访问一下http://localhost:8080/,消耗一下性能)
1
2
3
|
go tool pprof -http=":8081" http://localhost:8080/debug/pprof/profile
Fetching profile over HTTP from http://localhost:8080/debug/pprof/profile
Saved profile in /root/pprof/pprof.main.samples.cpu.007.pb.gz
|
如果出现 Could not execute dot; may need to install graphviz.,就是提示你要安装 graphviz 了.
安装 graphviz 软件包,在 ubuntu 系统可以使用下面的命令:
1
|
sudo apt-get install -y graphviz
|
过一段时间会产生个web窗口
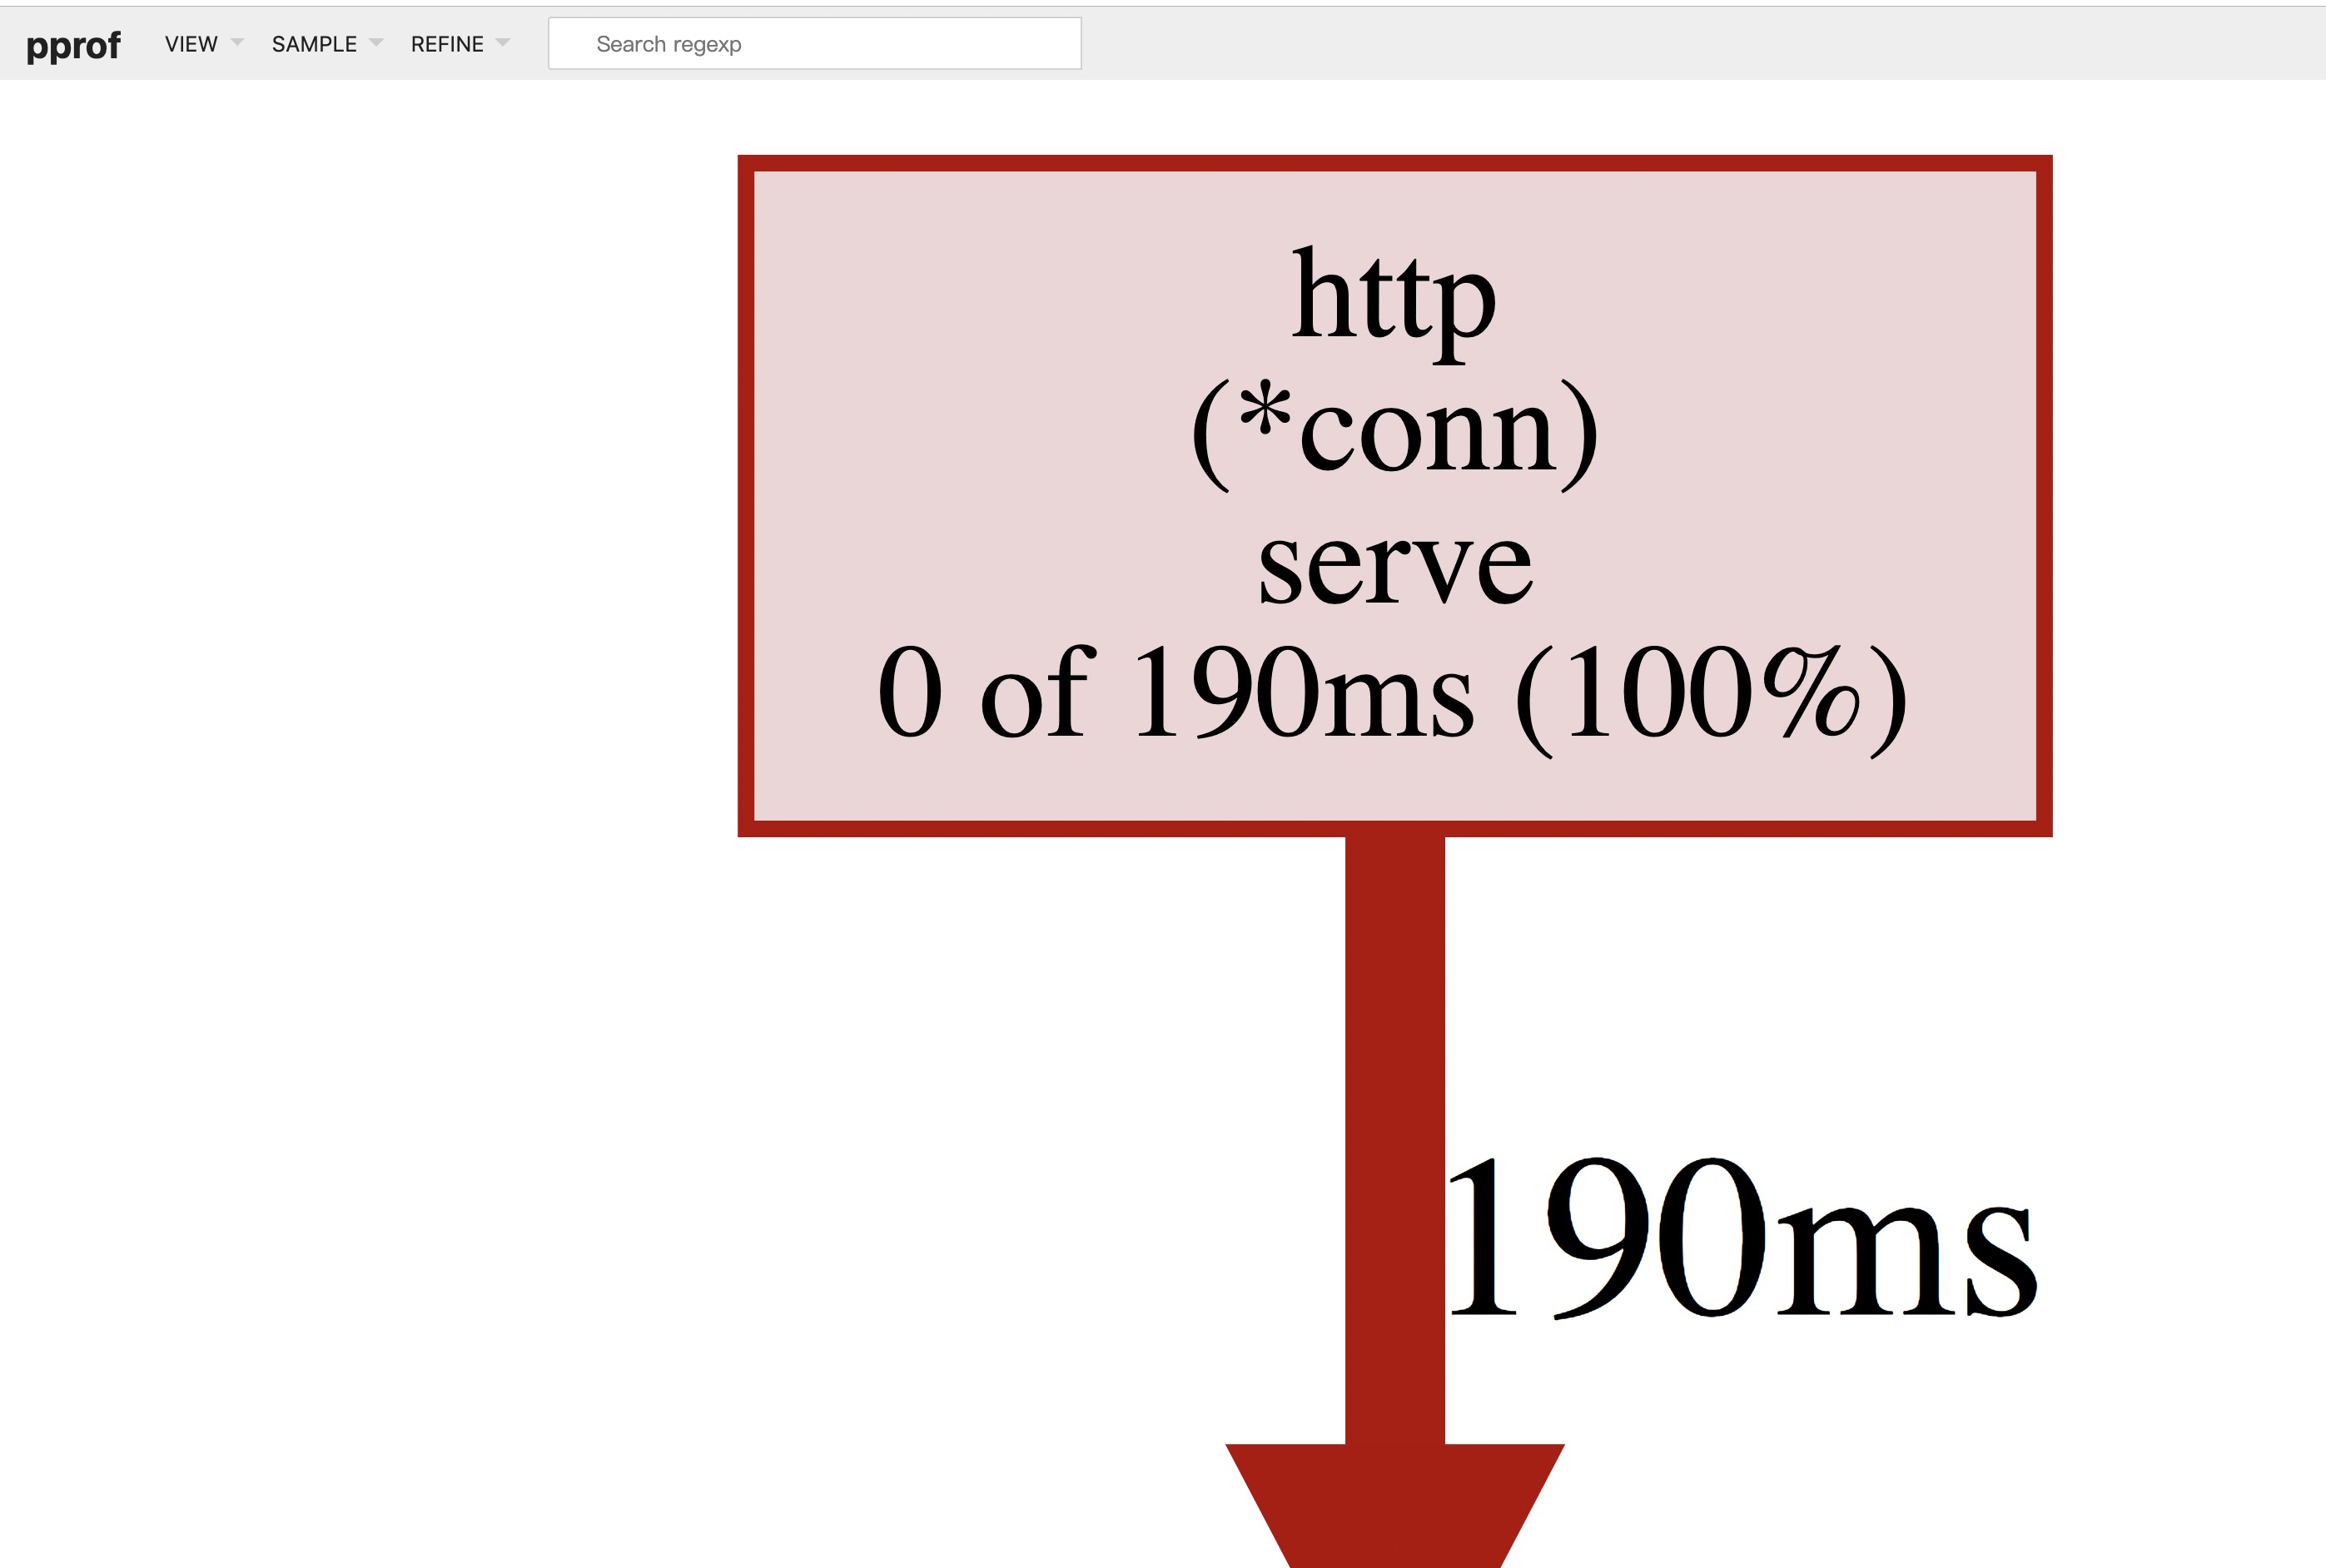
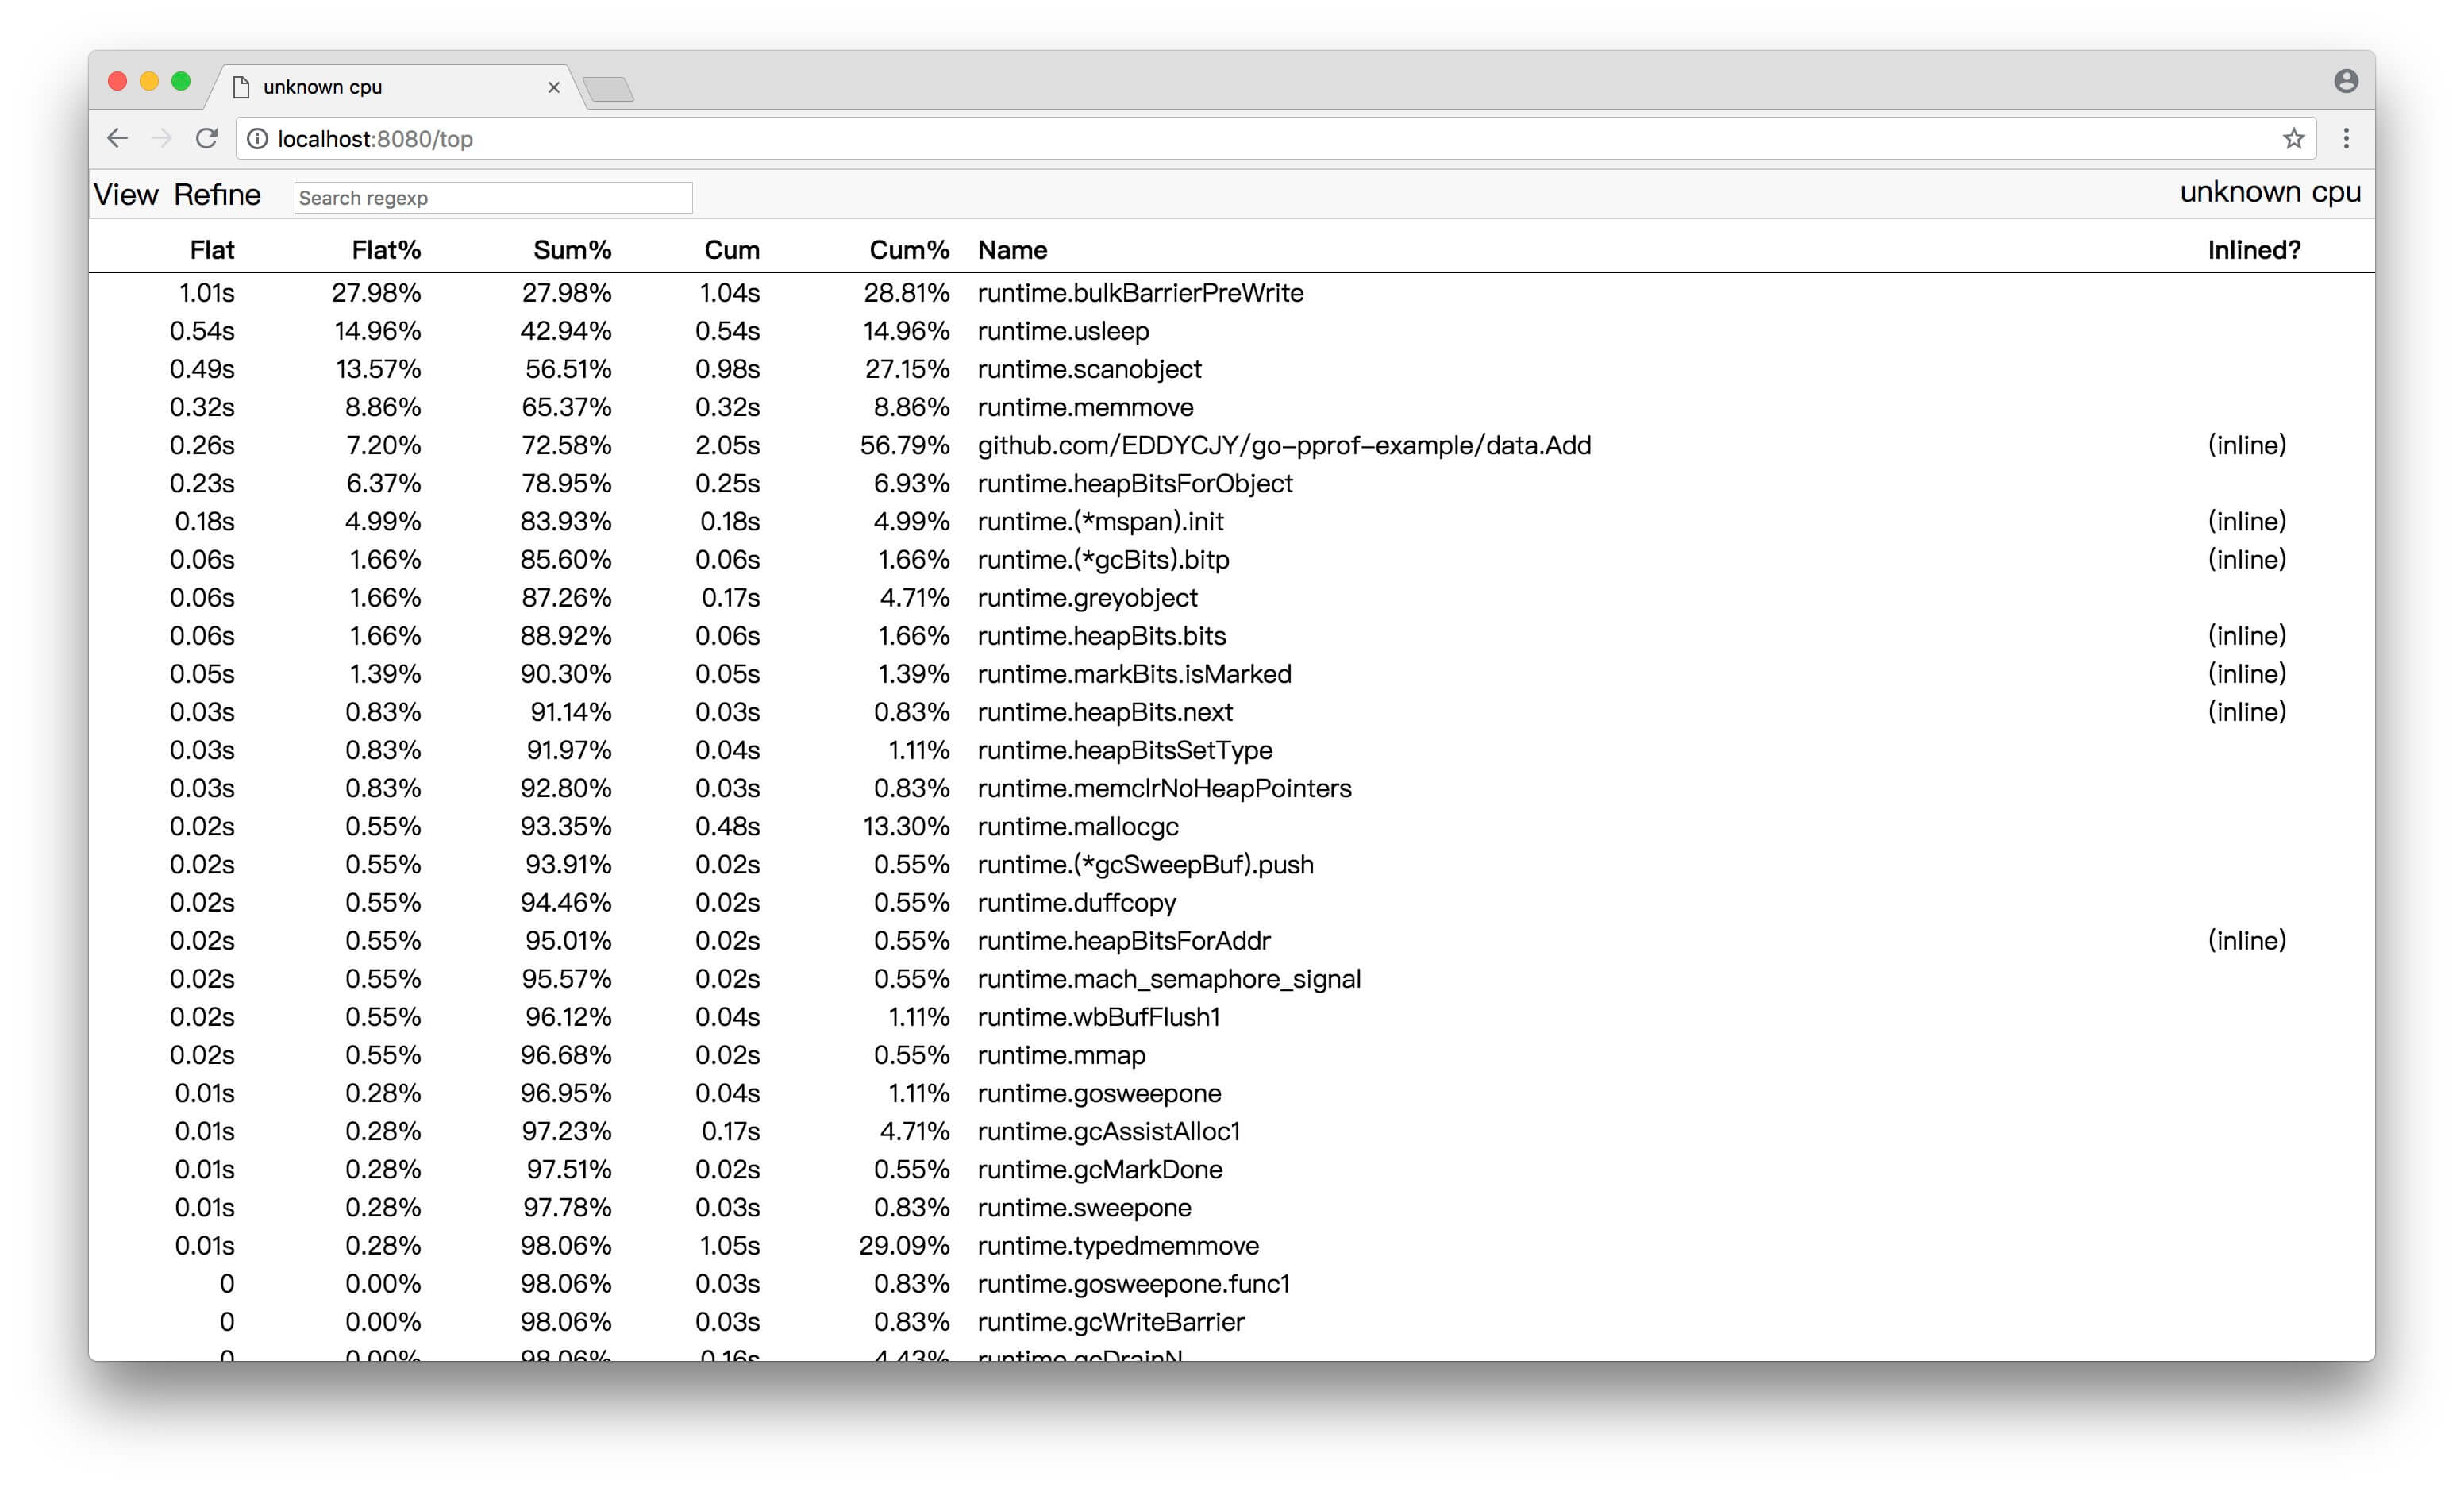
通过 PProf 的可视化界面,我们能够更方便、更直观的看到 Go 应用程序的调用链、使用情况等,并且在 View 菜单栏中,还支持如上多种方式的切换
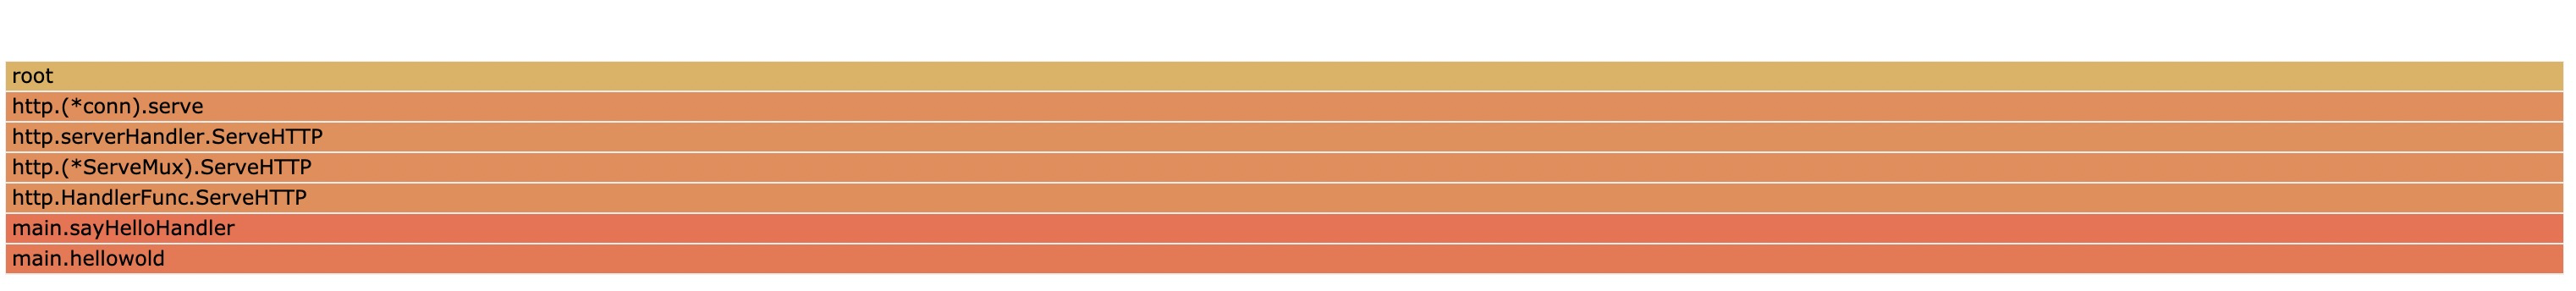
(1)Top
(2)Graph
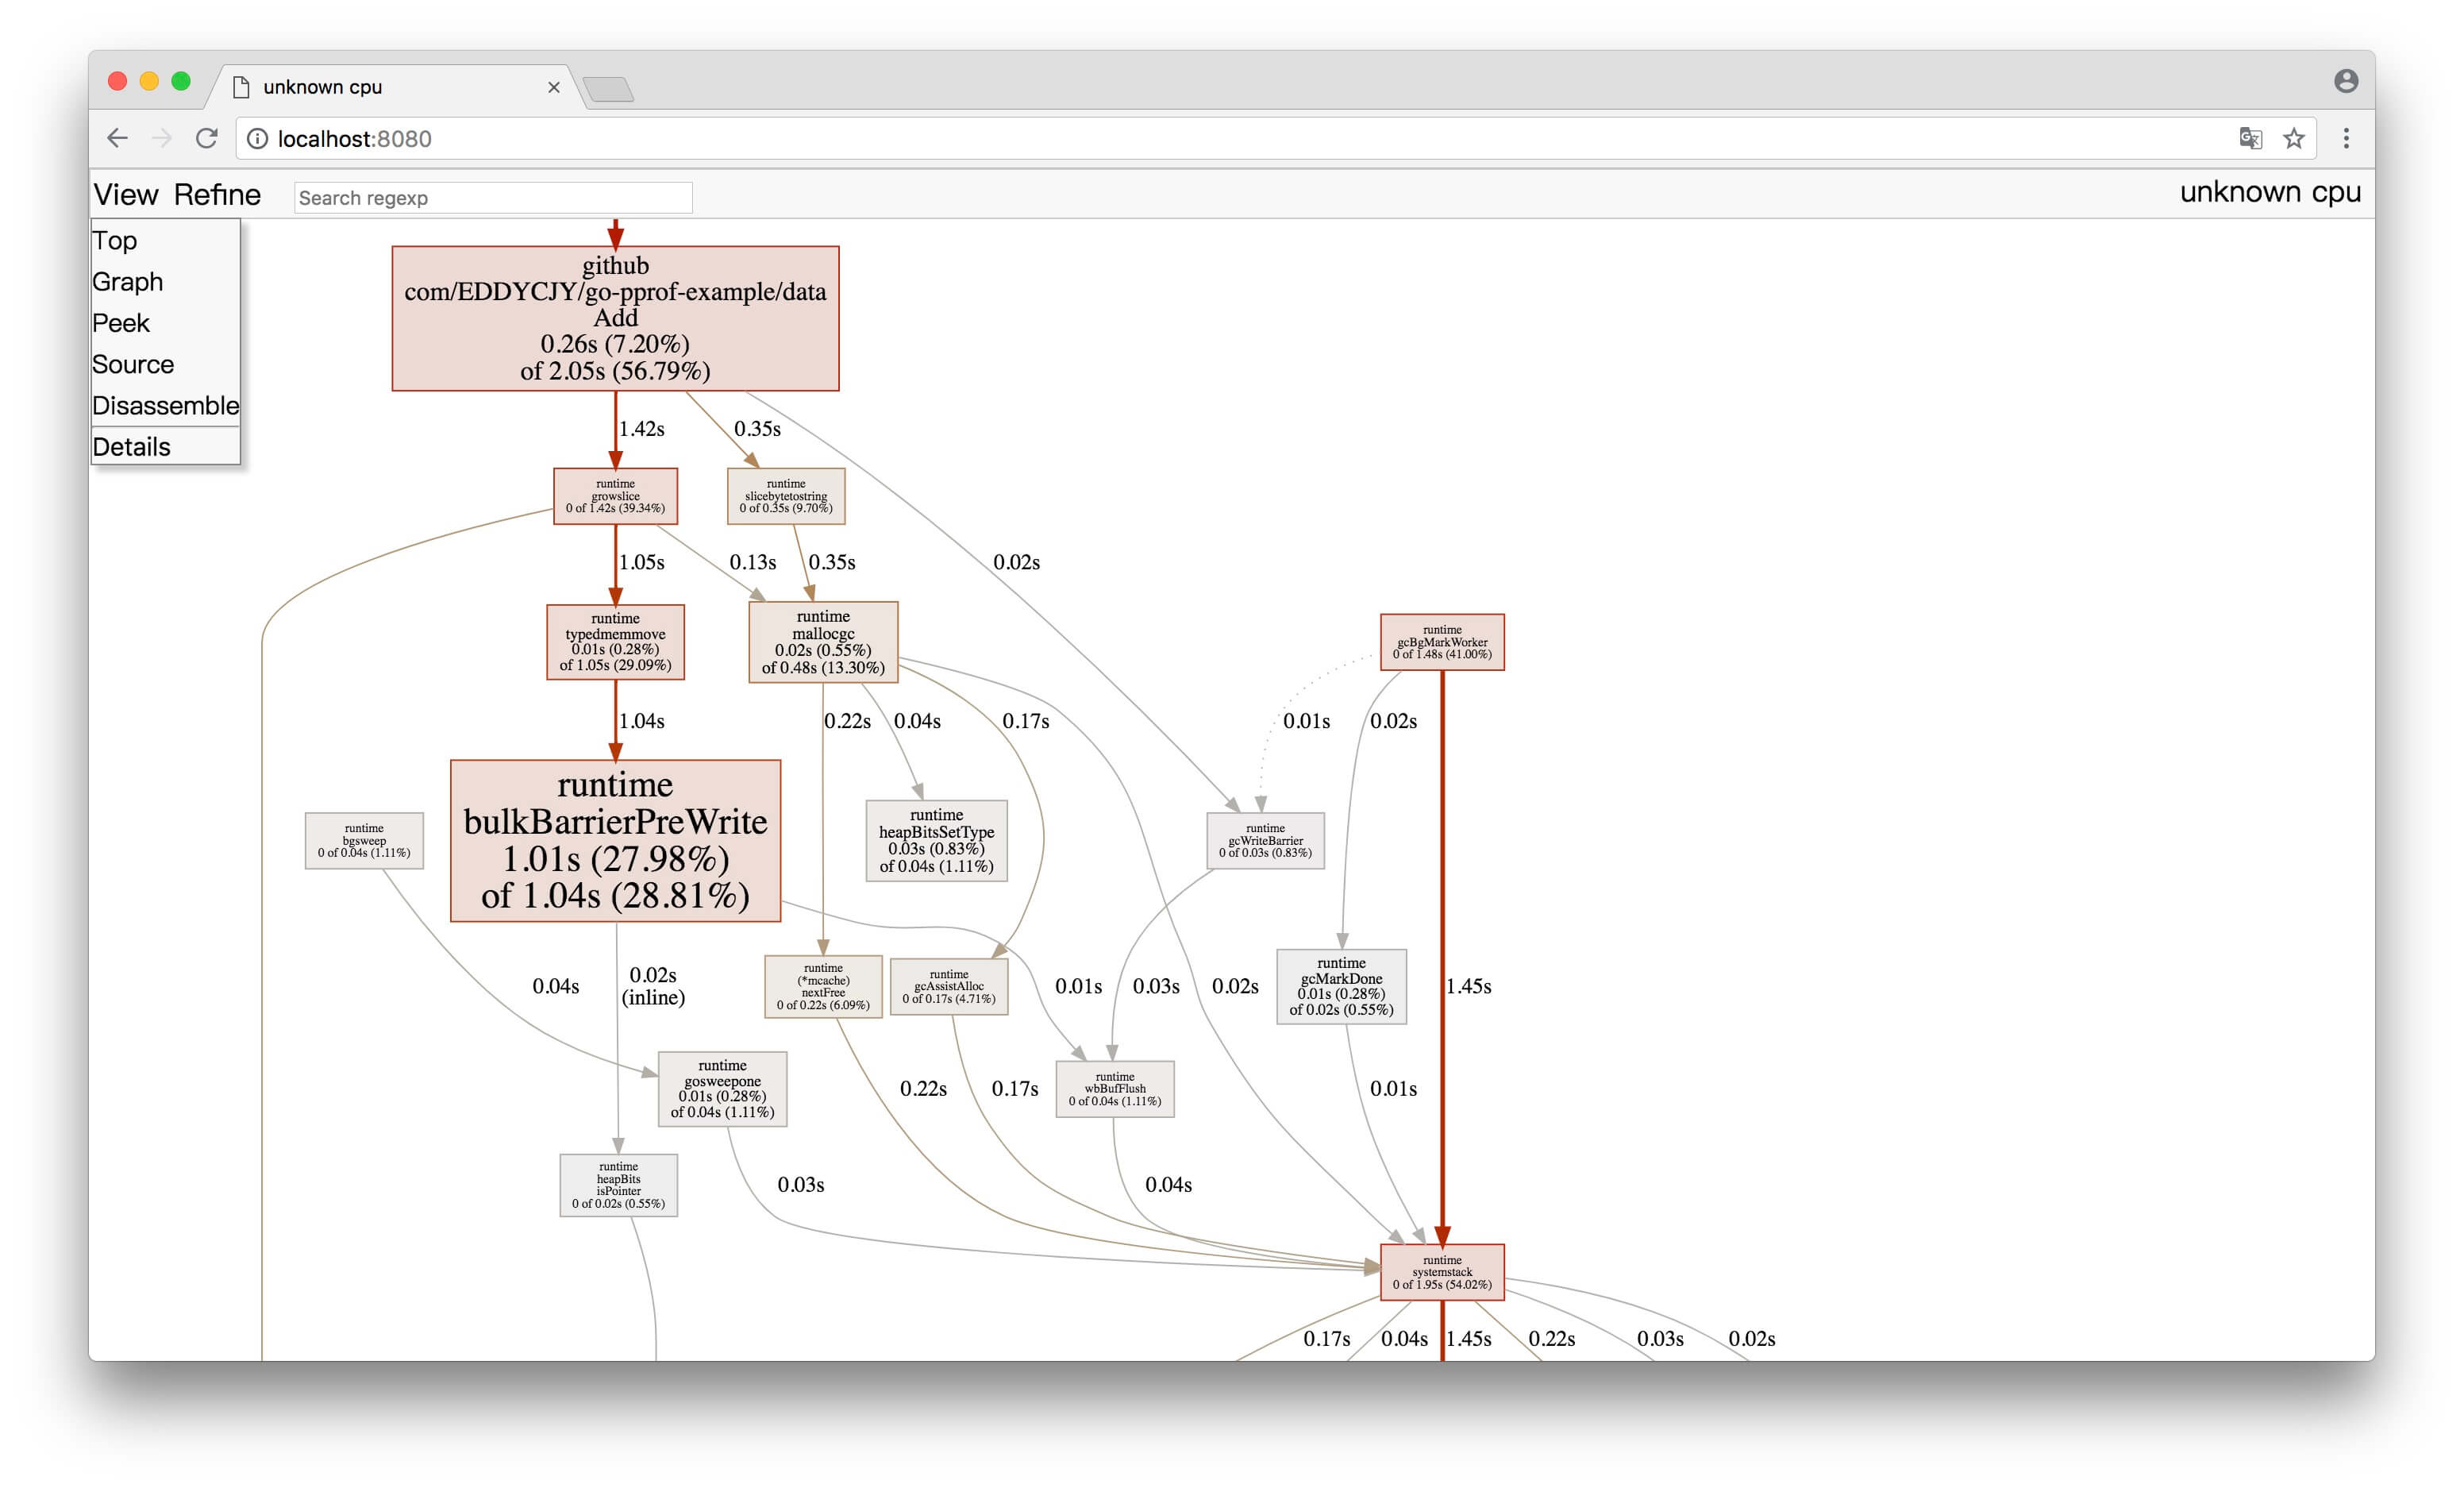
框越大,线越粗代表它占用的时间越大哦
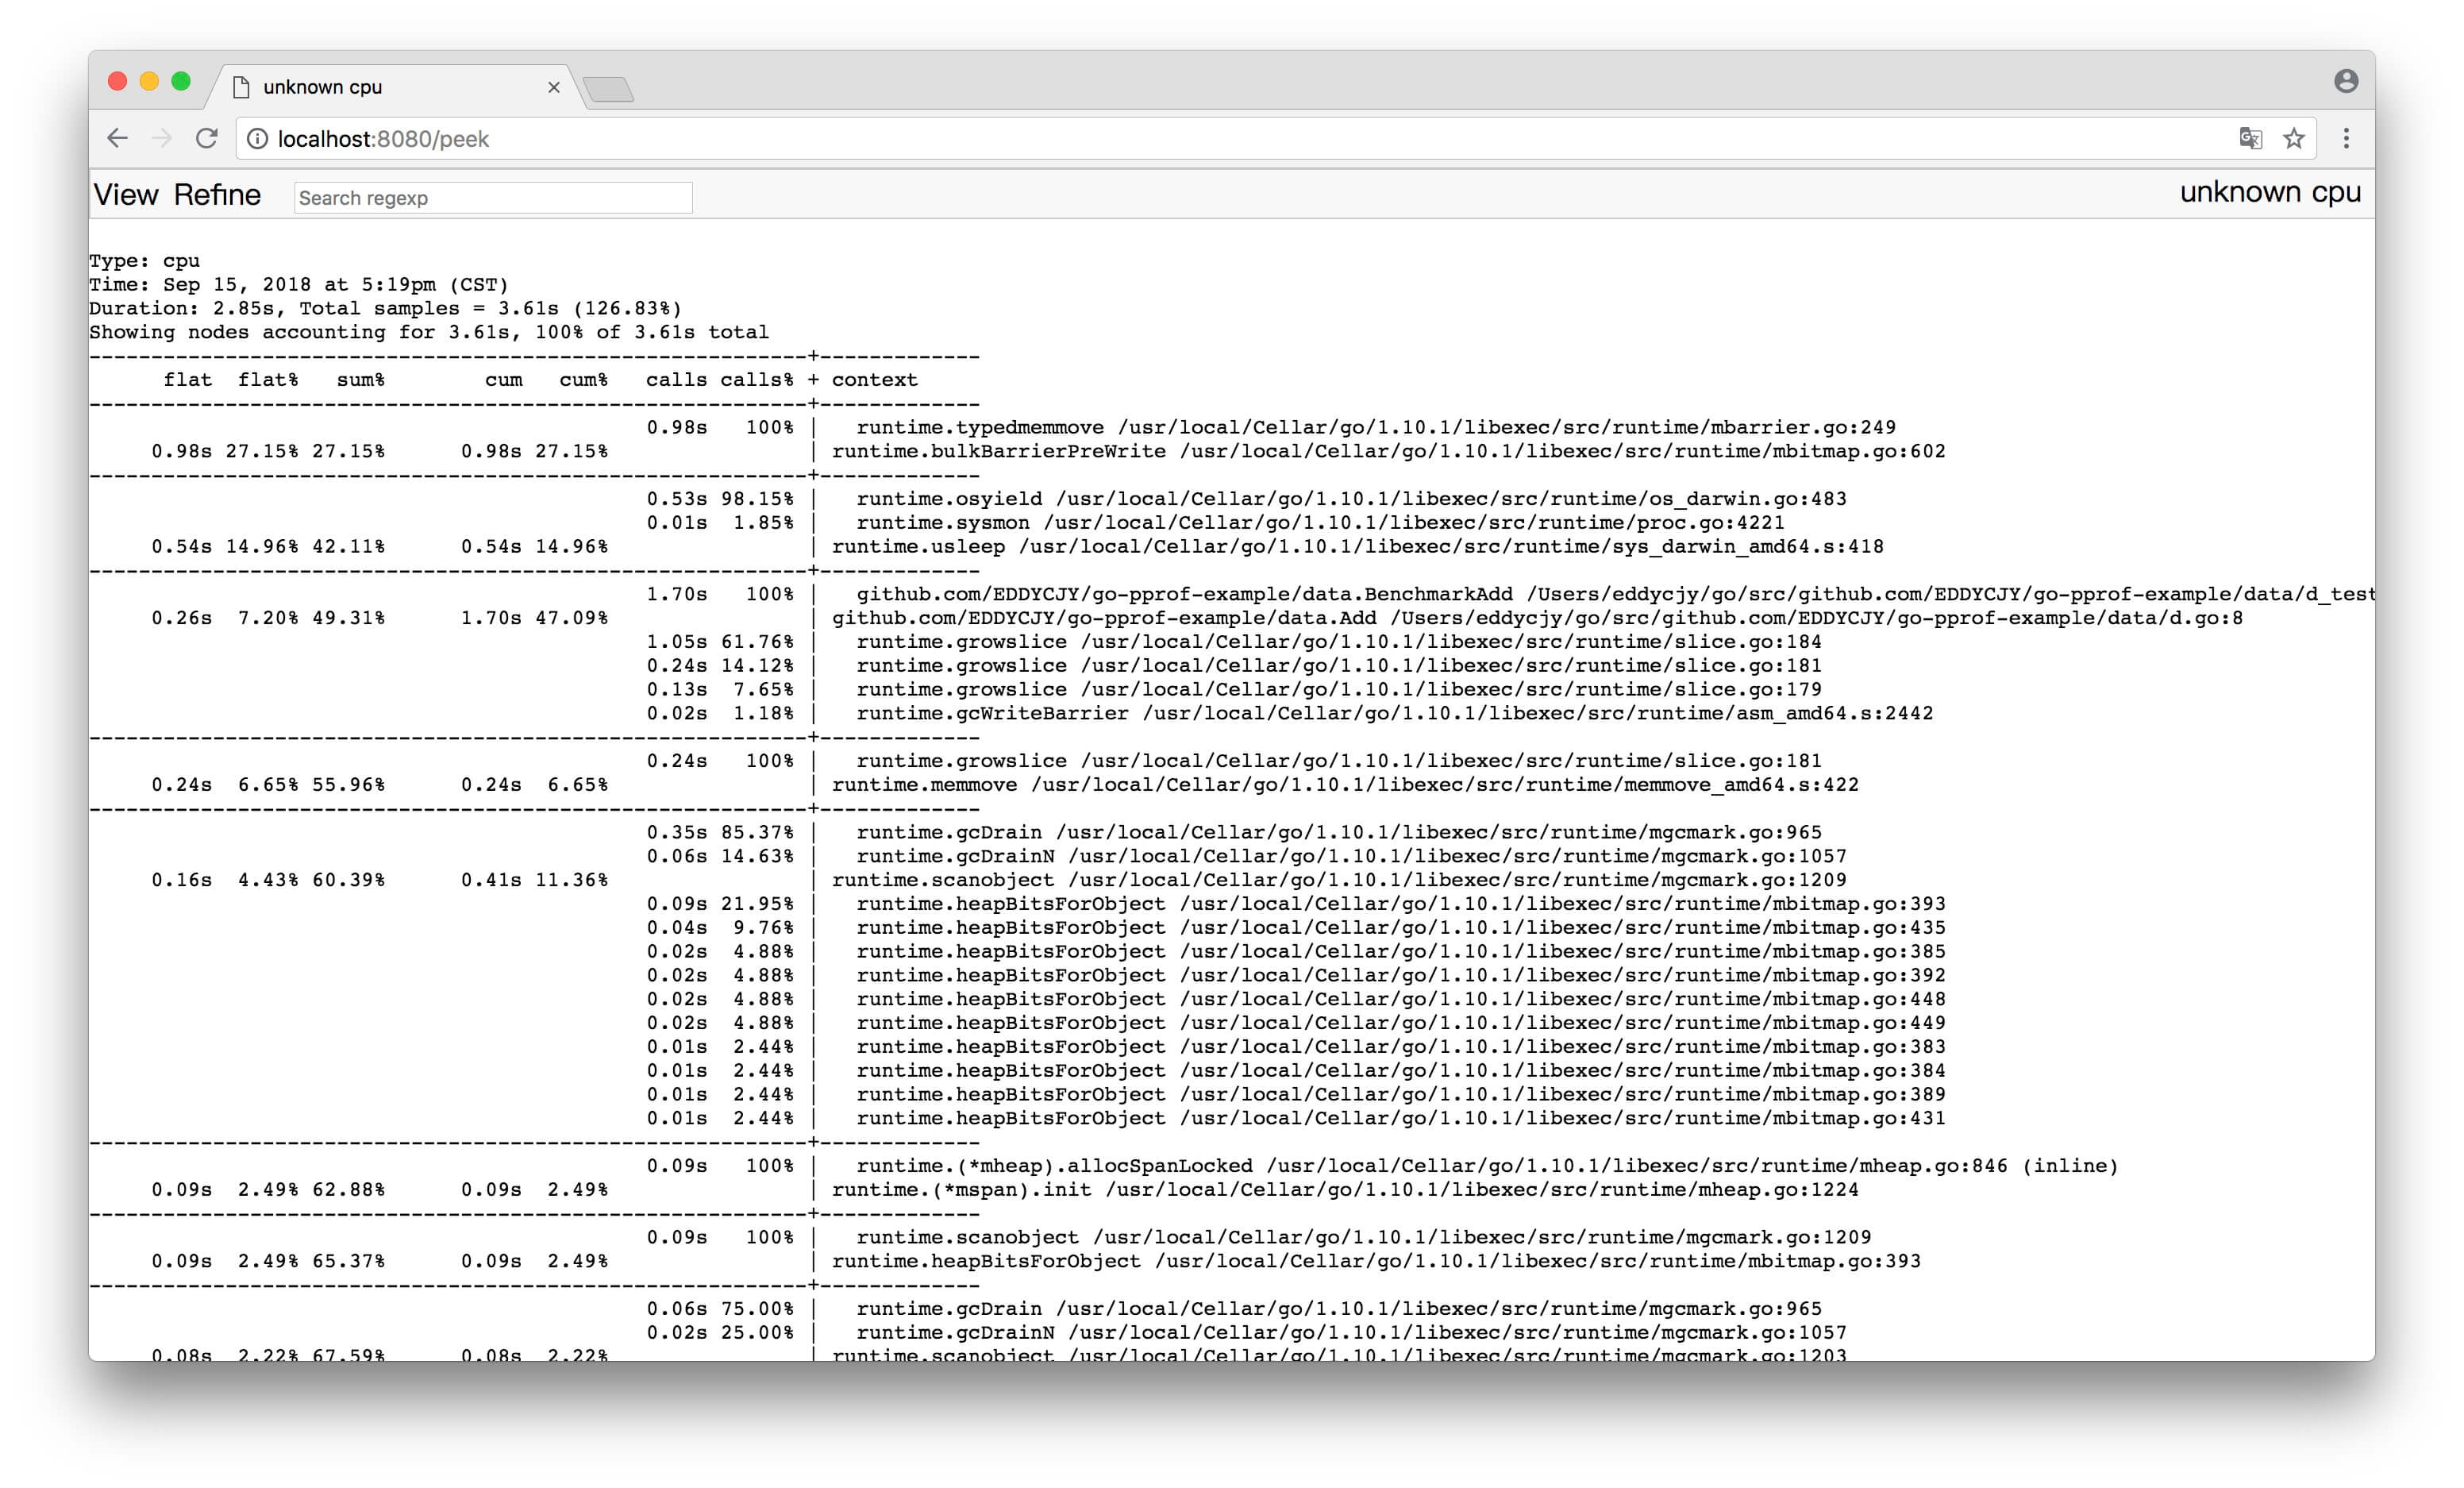
(3)Peek
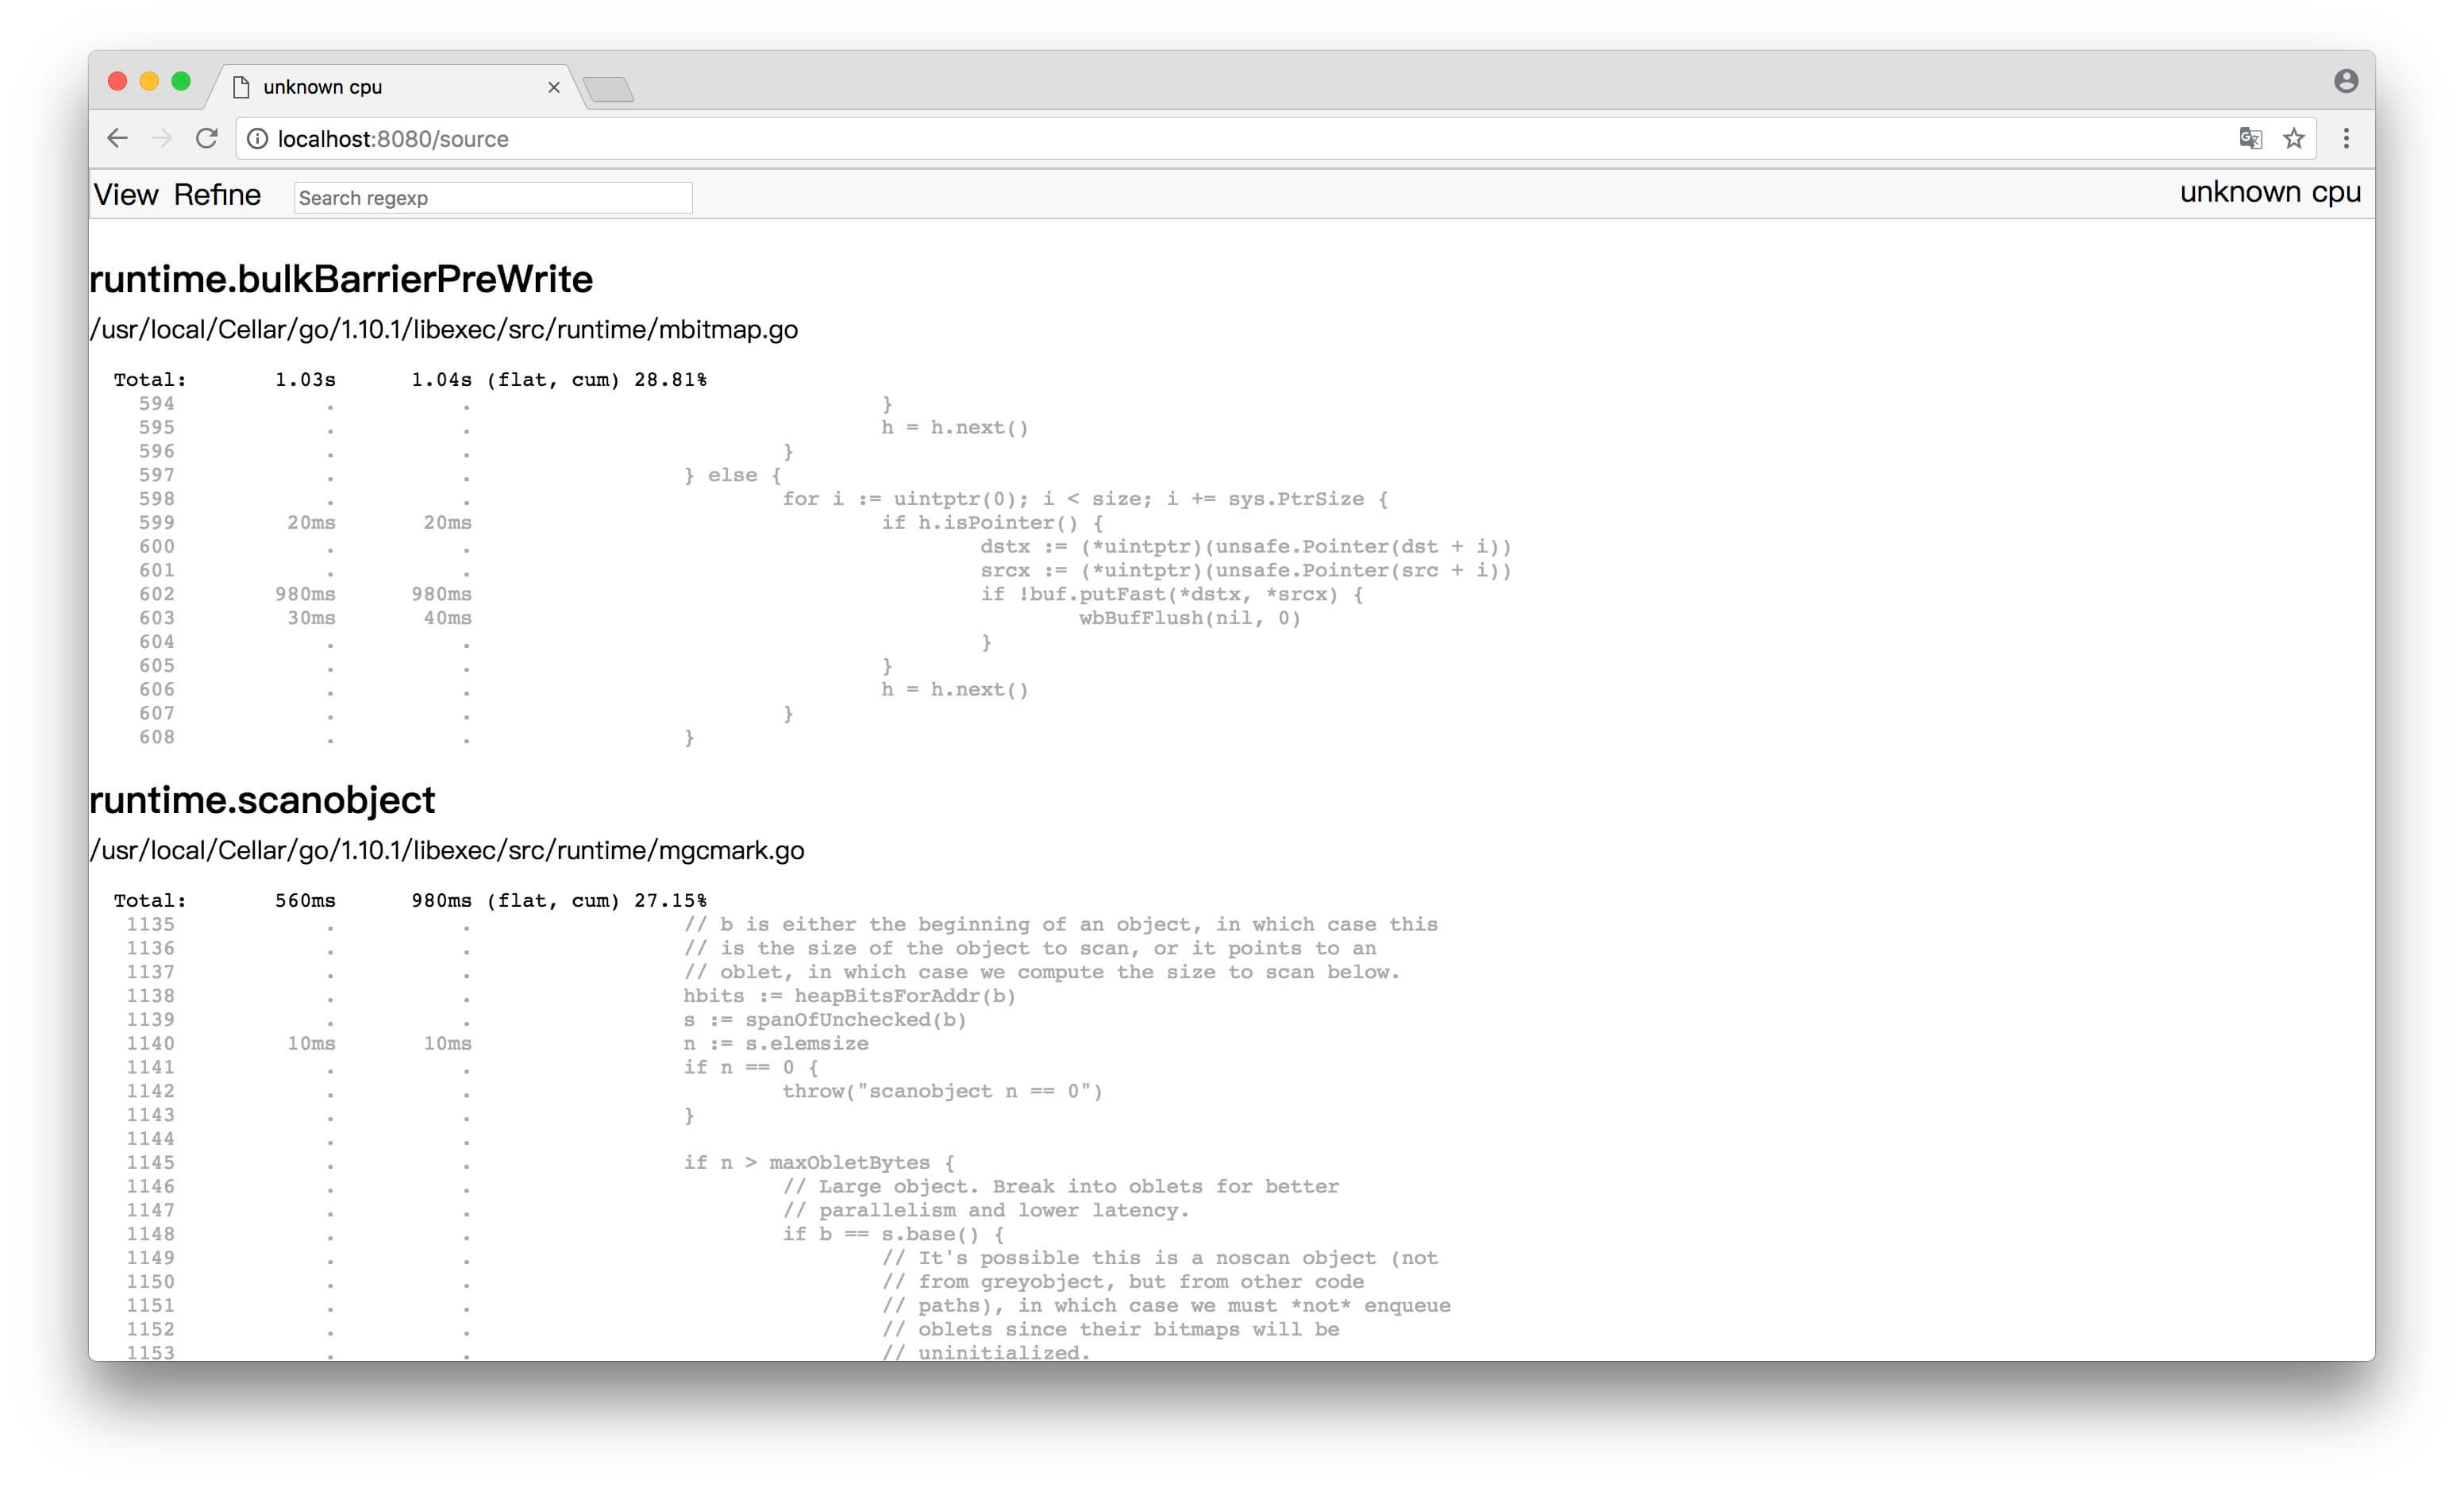
(4)Source
(5) 火焰图
它和一般的火焰图相比刚好倒过来了,调用关系的展现是从上到下。形状越长,表示执行时间越长。
如果检查heap状态,则命令如下:
1
|
go tool pprof -http=":8081" http://127.0.0.1:8080/debug/pprof/heap
|
火焰图
火焰图(Flame Graph)是 Bredan Gregg 创建的一种性能分析图表,因为它的样子近似火焰而得名。上面的 profiling 结果也转换成火焰图.
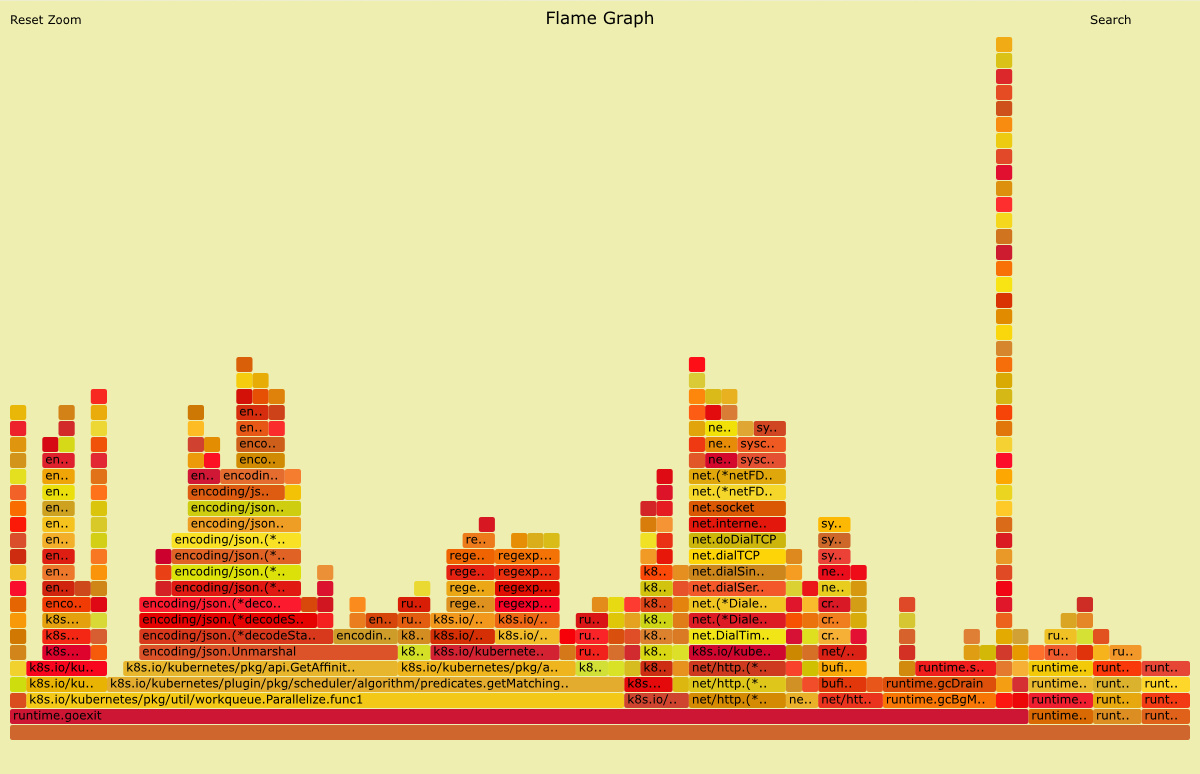
火焰图 svg 文件可以通过浏览器打开,它对于调用图的最优点是它是动态的:可以通过点击每个方块来 zoom in 分析它上面的内容。
y 轴表示调用栈,每一层都是一个函数。调用栈越深,火焰就越高,顶部就是正在执行的函数,下方都是它的父函数。
x 轴表示抽样数,如果一个函数在 x 轴占据的宽度越宽,就表示它被抽到的次数多,即执行的时间长。注意,x 轴不代表时间,而是所有的调用栈合并后,按字母顺序排列的。
火焰图就是看顶层的哪个函数占据的宽度最大。只要有”平顶”(plateaus),就表示该函数可能存在性能问题。
火焰图的配色并没有特殊的意义,默认的红、黄配色是为了更像火焰而已。
火焰图使用:
- 鼠标悬浮
火焰的每一层都会标注函数名,鼠标悬浮时会显示完整的函数名、抽样抽中的次数、占据总抽样次数的百分比
- 点击放大
在某一层点击,火焰图会水平放大,该层会占据所有宽度,显示详细信息
- 搜索
按下 Ctrl + F 会显示一个搜索框,用户可以输入关键词或正则表达式,所有符合条件的函数名会高亮显示
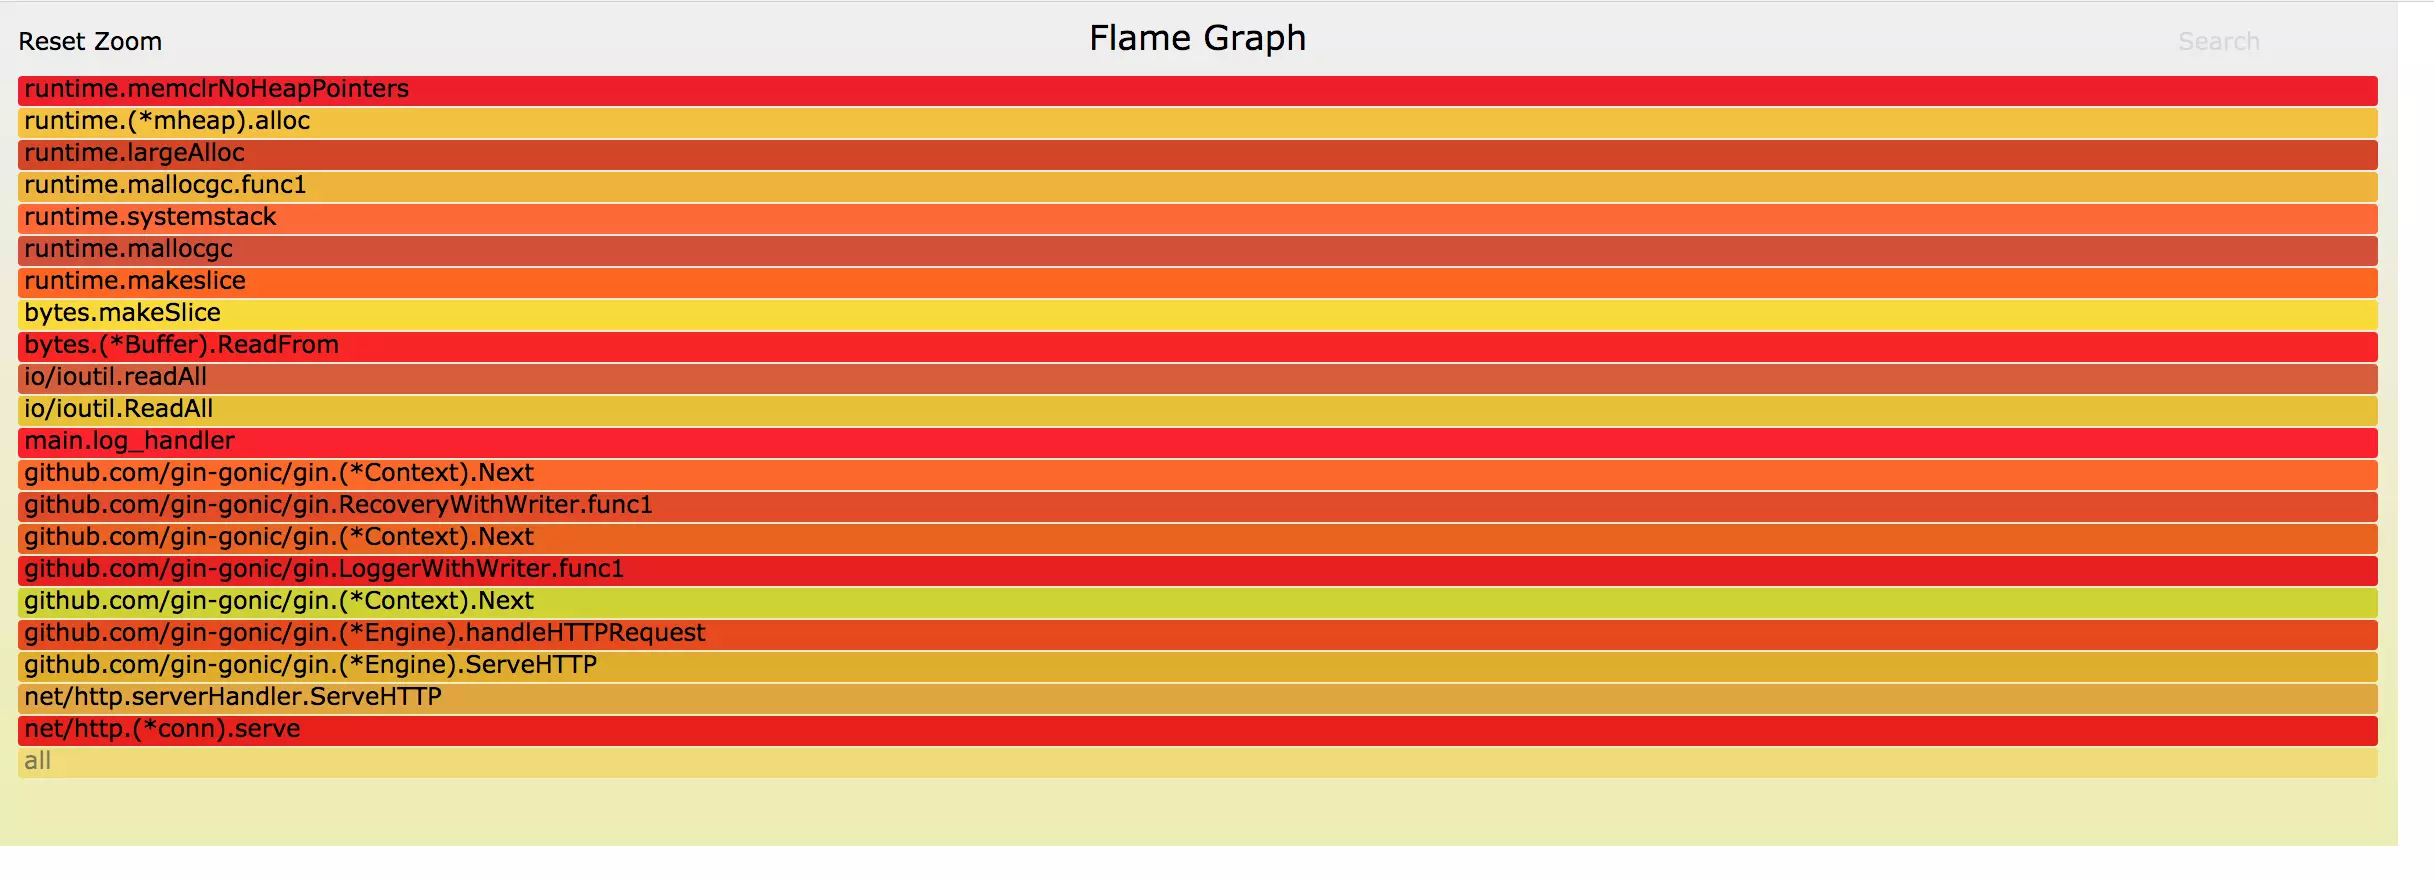
举例
生成 CPU 火焰图
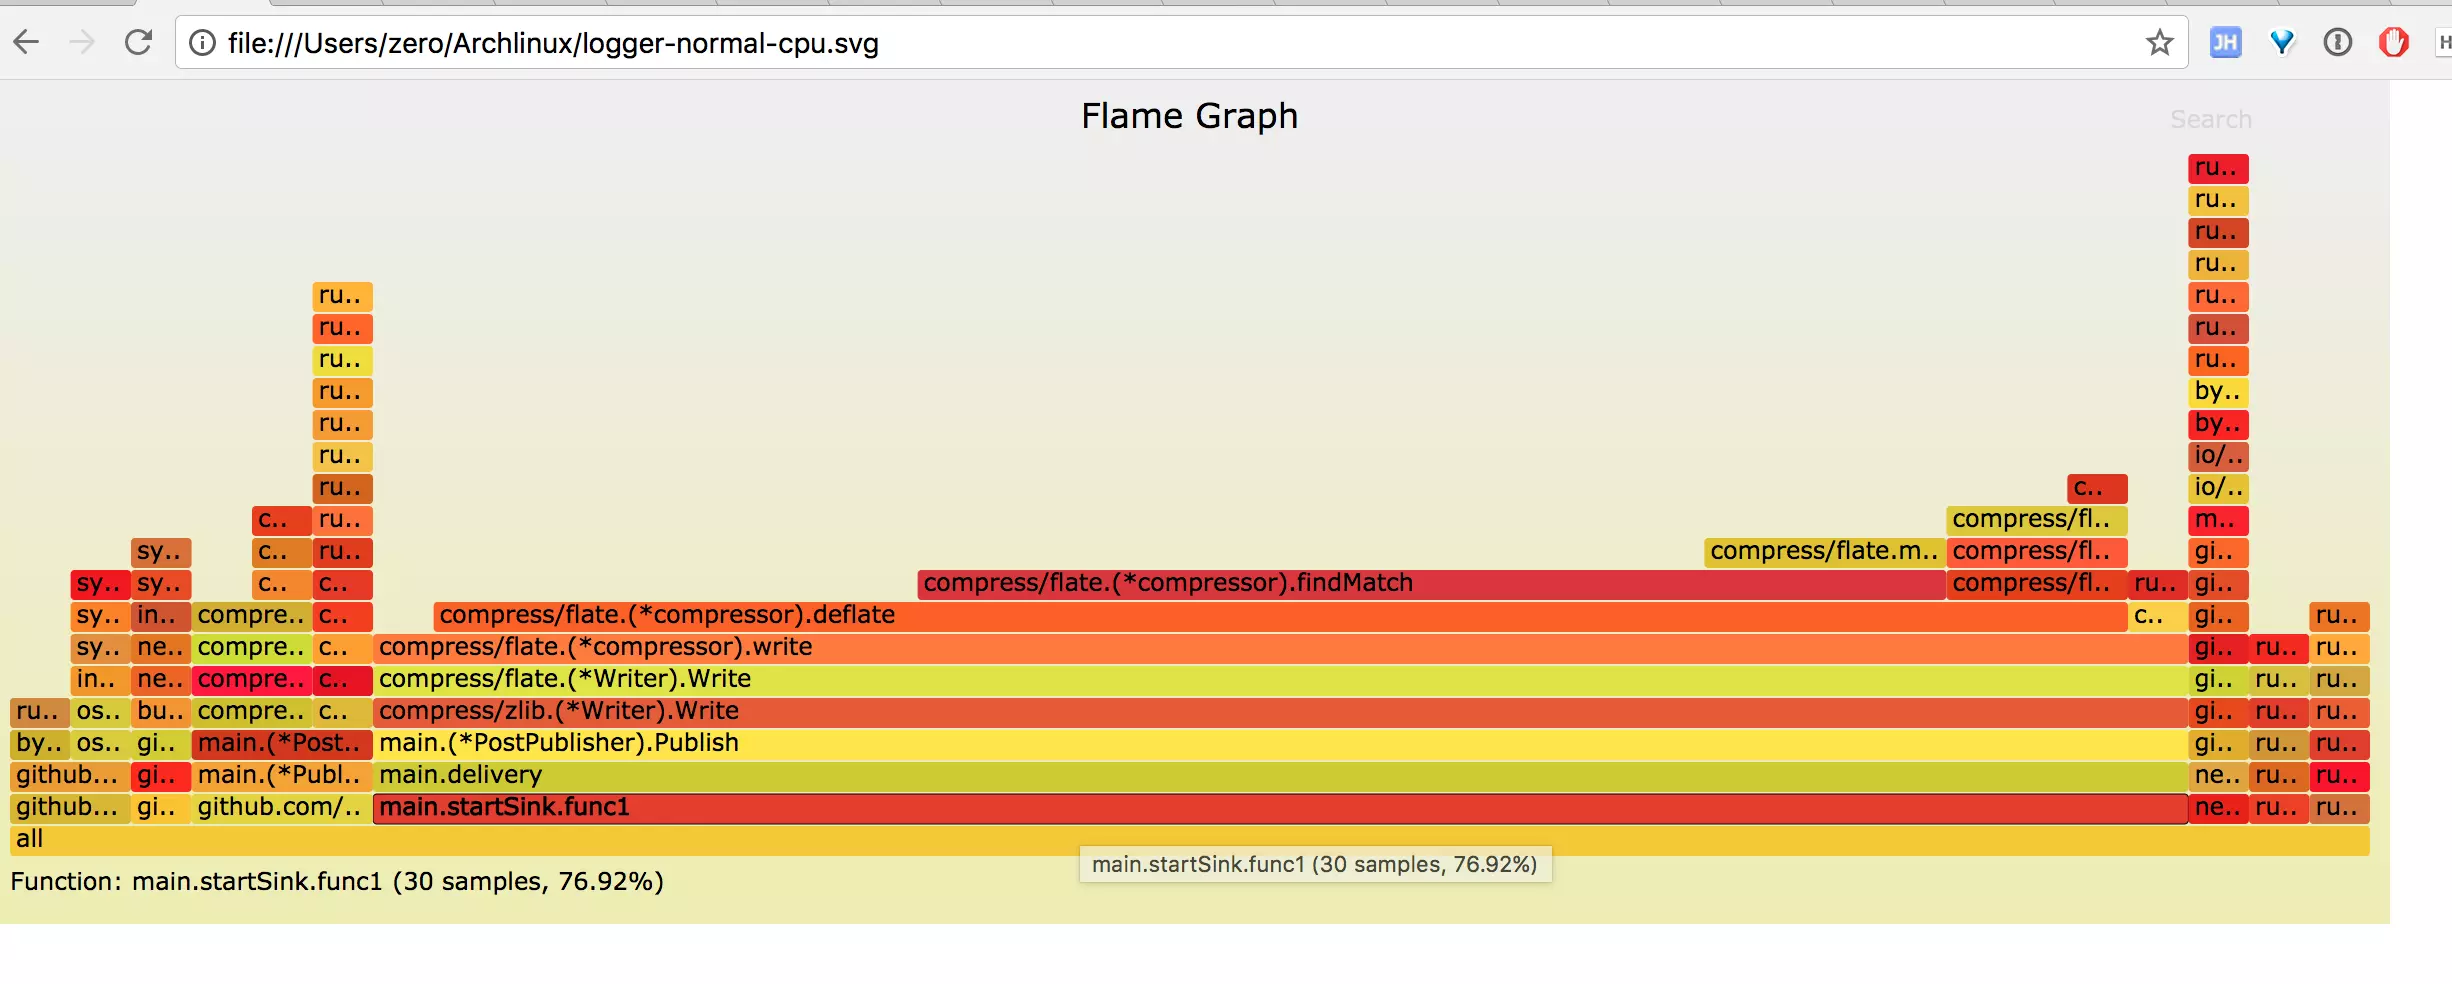
从图中能一眼看到 publish 函数中的压缩操作占了 70% 左右的 CPU。
而 gin httpserver 只占用了 2% 左右的 CPU, 和我们使用 go tool pprof 的 top 命令分析的结果一致。
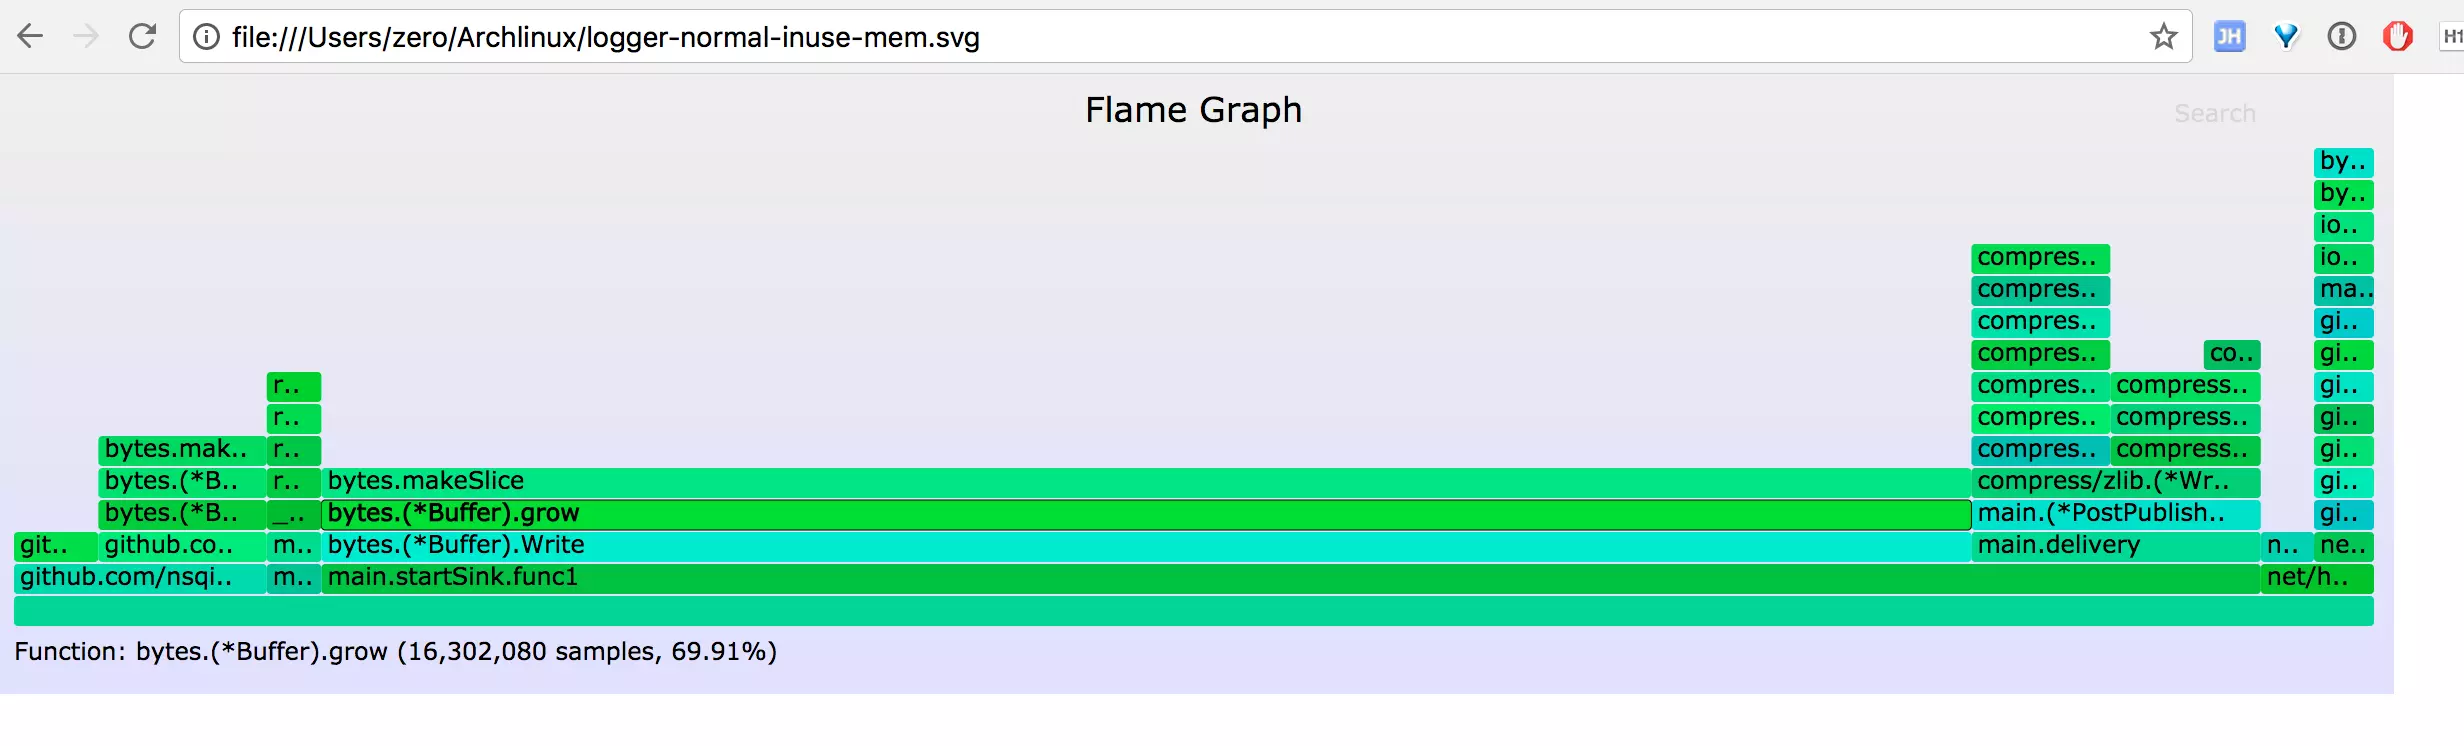
默认情况下采集的是 CPU 的 profile, 这里介绍下 mem 火焰图的采集。
inuse_space 火焰图
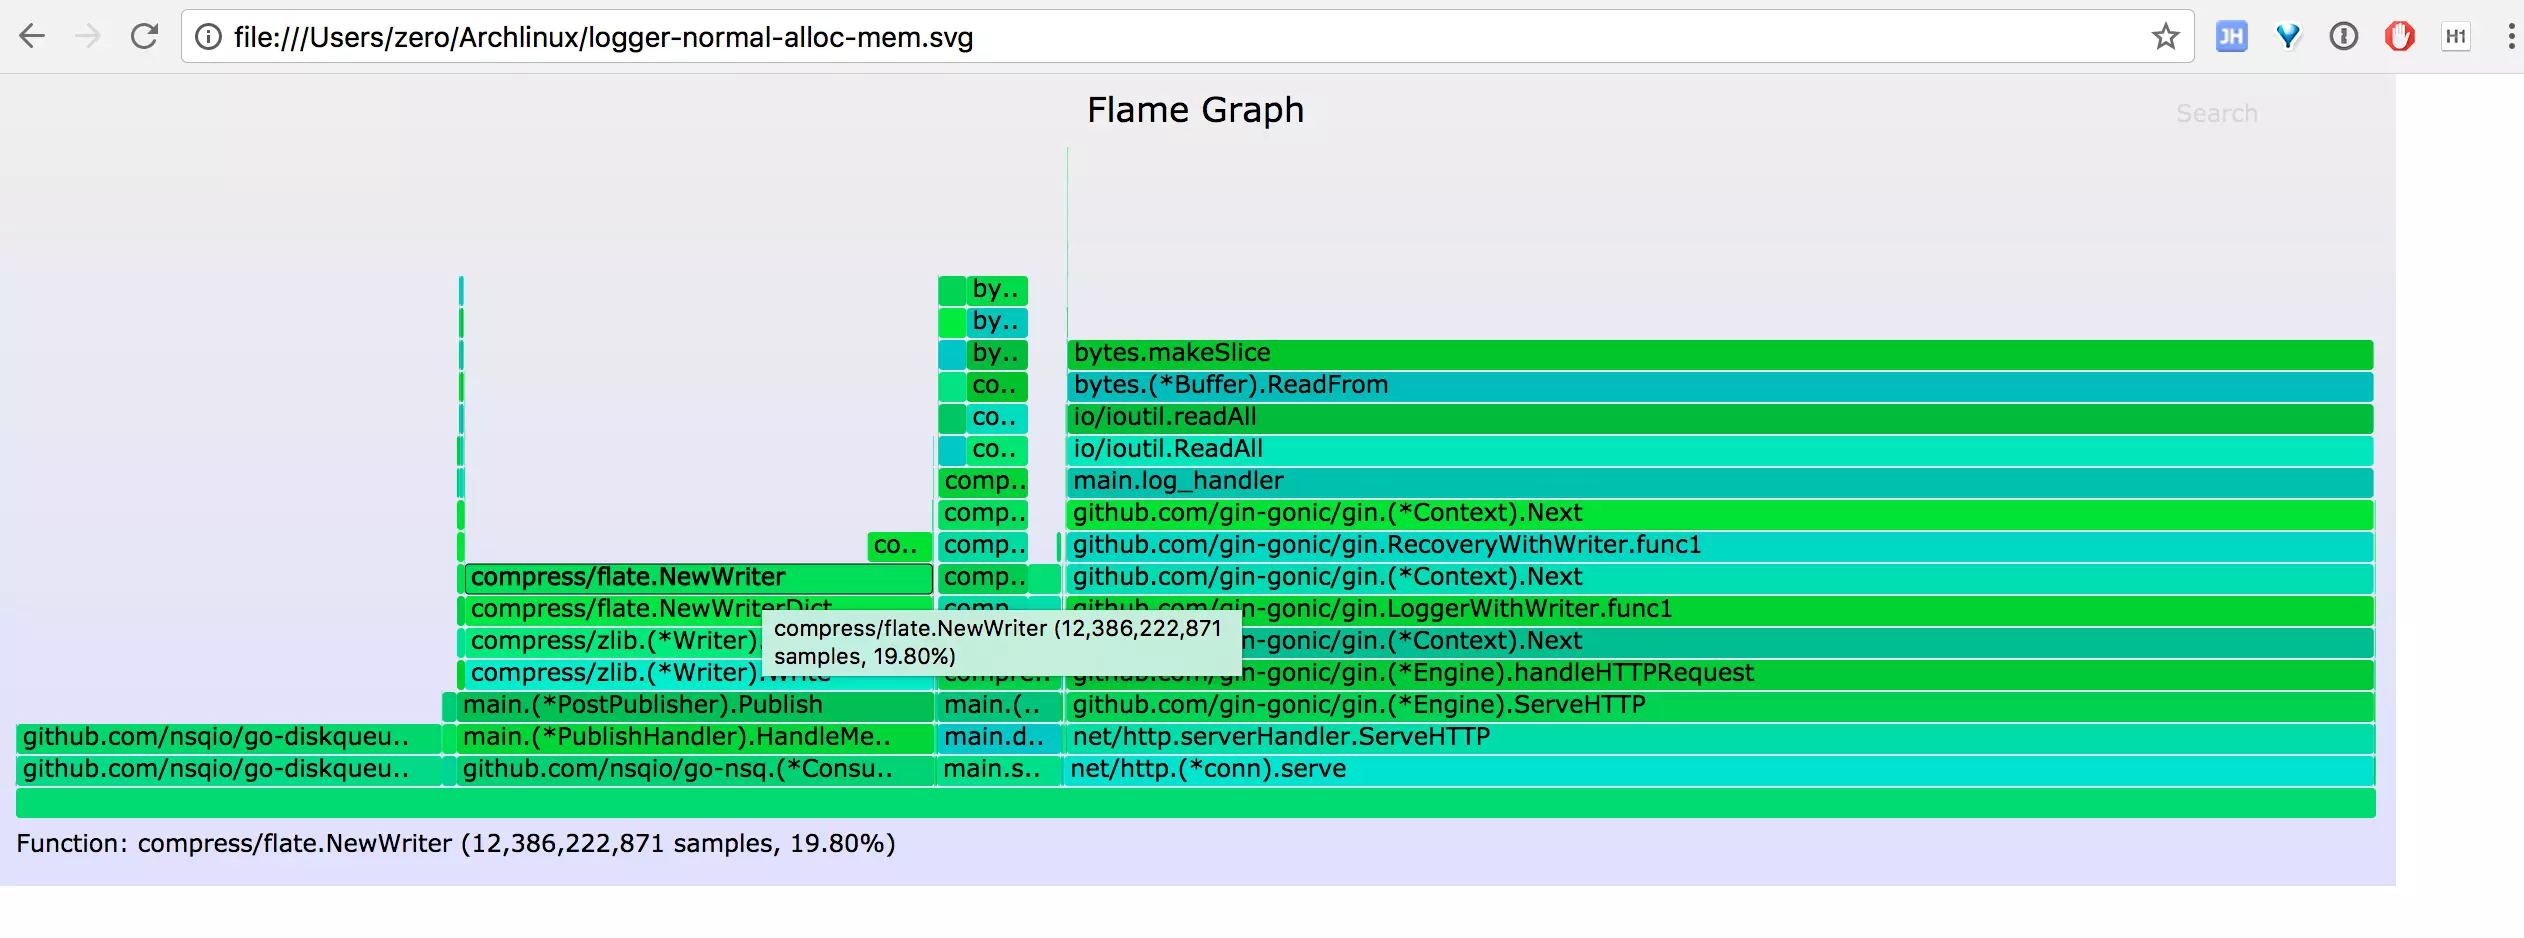
alloc_space 火焰图
内存泄露检查
检查Go程序内存的使用情况最常用的就是Go标准库自带的pprof库了,可以通过http暴露出这个profile, 然后通过go tool pprof或者pprof工具命令行/web方式查看。
比如下面的命令, 可以获取服务器http://ip:port的堆信息,并且在本机9090端口启动一个服务器展示堆的信息。
1
|
go tool pprof -http :9090 http://ip:port/debug/pprof/heap
|
在堆信息中你可以查看分配的堆的大小和对象数量,或者当前没有释放的占用的堆的大小和对象数量。
正常情况下使用这个方式就可以比较直观的看到哪一段代码分配的内存比较多,然后确定那里容易产生内存泄漏。
但是, 分配堆内存比较多的地方并不一定产生内存泄漏,只能说明这个地方"曾经/正在"分配的堆内存比较大,或者分配的堆内存比较频繁俄安,这些分配的内存可能在之后就回收掉了。
pprof可以比较两个时间点的分配的内存的差值,通过比较差值,就容易看到哪些地方产生的内存"残留"的比较多,没有被内存释放,极有可能是内存泄漏的点。
你可以通过下面的方式产生两个时间点的堆的profile,之后使用pprof工具进行分析。
- 首先确保你已经配置了pprof的http路径, 可以访问http://ip:port/debug/pprof/查看路径(如果你没有修改默认的pprof)
- 导出时间点1的堆的profile:
curl -s http://127.0.0.1:8080/debug/pprof/heap > base.heap, 我们把它作为基准点
- 喝杯茶,等待一段时间后导出时间点2的堆的profile:
curl -s http://127.0.0.1:8080/debug/pprof/heap > current.heap
- 现在你就可以比较这两个时间点的堆的差异了: go tool pprof –base base.heap current.heap
操作和正常的go tool pprof操作一样, 比如使用top查看使用堆内存最多的几处地方的内存增删情况:
使用web命令会生成一个SVG文件,可能你需要使用浏览器打开它。
或者你直接使用命令打开web界面: go tool pprof –http :9090 –base base.heap current.heap。
参考
https://cizixs.com/2017/09/11/profiling-golang-program/
https://segmentfault.com/a/1190000016412013
https://blog.csdn.net/guyan0319/article/details/85007181
https://qcrao.com/2019/11/10/dive-into-go-pprof/
https://lrita.github.io/2017/05/26/golang-memory-pprof/
https://zhuanlan.zhihu.com/p/51559344
https://github.com/sxs2473/go-performane-tuning/blob/master/3.%E6%80%A7%E8%83%BD%E6%B5%8B%E9%87%8F%E5%92%8C%E5%88%86%E6%9E%90/%E6%80%A7%E8%83%BD%E6%B5%8B%E9%87%8F%E5%92%8C%E5%88%86%E6%9E%90.md
https://www.jianshu.com/p/043533eec401
https://colobu.com/2019/08/20/use-pprof-to-compare-go-memory-usage/
http://io.upyun.com/2018/01/21/debug-golang-application-with-pprof-and-flame-graph/
https://juejin.im/entry/5ac9cf3a518825556534c76e
Memory Profiling