性能测试
专有名词
1、吞吐量(Requests per second)
概念:服务器并发处理能力的量化描述,单位是reqs/s,指的是某个并发用户数下单位时间内处理的请求数。某个并发用户数下单位时间内能处理的最大请求数,称之为最大吞吐率。 计算公式:总请求数 / 处理完成这些请求数所花费的时间,即 Request per second = Complete requests / Time taken for tests
2、并发连接数(The number of concurrent connections)
概念:某个时刻服务器所接受的请求数目,简单的讲,就是一个会话。
3、并发用户数(The number of concurrent users,Concurrency Level)
概念:要注意区分这个概念和并发连接数之间的区别,一个用户可能同时会产生多个会话,也即连接数。
4、用户平均请求等待时间(Time per request)
计算公式:处理完成所有请求数所花费的时间/ (总请求数 / 并发用户数),即 Time per request = Time taken for tests /( Complete requests / Concurrency Level)
5、服务器平均请求等待时间(Time per request: across all concurrent requests)
计算公式:处理完成所有请求数所花费的时间 / 总请求数,即 Time taken for / testsComplete requests 可以看到,它是吞吐率的倒数。 同时,它也=用户平均请求等待时间/并发用户数,即 Time per request / Concurrency Level
为什么平均值不靠谱
关于平均值为什么不靠谱,我相信大家读新闻的时候经常可以看到,平均工资,平均房价,平均支出,等等这样的字眼,你就知道为什么平均值不靠谱了。(这些都是数学游戏,对于理工科的同学来说,天生应该有免疫力)
软件的性能测试也一样,平均数也是不靠谱的,这里可以参看这篇详细的文章《Why Averages Suck and Percentiles are Great》,我在这里简单说一下。
我们知道,性能测试时,测试得到的结果数据不总是一样的,而是有高有低的,如果算平均值就会出现这样的情况,假如,测试了10次,有9次是1ms,而有1次是1s,那么平均数据就是100ms,很明显,这完全不能反应性能测试的情况,也许那1s的请求就是一个不正常的值,是个噪点,应该去掉。所以,我们会在一些评委打分中看到要去掉一个最高分一个最低分,然后再算平均值。
另外,中位数(Mean)可能会比平均数要稍微靠谱一些,所谓中位数的意就是把将一组数据按大小顺序排列,处在最中间位置的一个数叫做这组数据的中位数 ,这意味着至少有50%的数据低于或高于这个中位数。
当然,最为正确的统计做法是用百分比分布统计。也就是英文中的TP – Top Percentile ,TP50的意思在,50%的请求都小于某个值,TP90表示90%的请求小于某个时间。
比如:我们有一组数据:[ 10ms, 1s, 200ms, 100ms],我们把其从小到大排个序:[10ms, 100ms, 200ms, 1s],于是我们知道,TP50,就是50%的请求ceil(40.5)=2时间是小于100ms的,TP90就是90%的请求ceil(40.9)=4时间小于1s。于是:TP50就是100ms,TP90就是1s。
我以前在路透做的金融系统响应时间的性能测试的要求是这样的,99.9%的请求必须小于1ms,所有的平均时间必须小于1ms。两个条件的限制。
为什么响应时间(latency)要和吞吐量(Thoughput)挂钩
系统的性能如果只看吞吐量,不看响应时间是没有意义的。我的系统可以顶10万请求,但是响应时间已经到了5秒钟,这样的系统已经不可用了,这样的吞吐量也是没有意义的。
我们知道,当并发量(吞吐量)上涨的时候,系统会变得越来越不稳定,响应时间的波动也会越来越大,响应时间也会变得越来越慢,而吞吐率也越来越上不去(如下图所示),包括CPU的使用率情况也会如此。所以,当系统变得不稳定的时候,吞吐量已经没有意义了。吞吐量有意义的时候仅当系统稳定的时候。
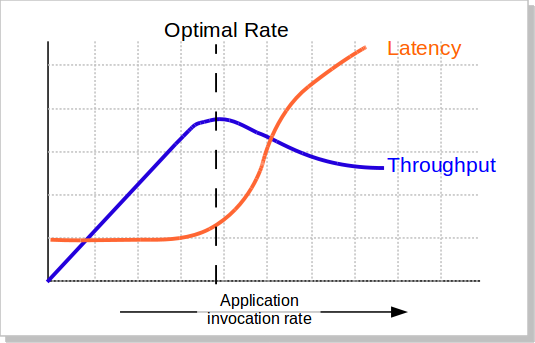
所以,吞吐量的值必需有响应时间来卡。比如:TP99小于100ms的时候,系统可以承载的最大并发数是1000qps。这意味着,我们要不断的在不同的并发数上测试,以找到软件的最稳定时的最大吞吐量。
为什么响应时间吞吐量和成功率要挂钩
我们这应该不难理解了,如果请求不成功的话,都还做毛的性能测试。比如,我说我的系统并发可以达到10万,但是失败率是
40%,那么,这10万的并发完全就是一个笑话了。
性能测试的失败率的容忍应该是非常低的。对于一些关键系统,成功请求数必须在100%,一点都不能含糊。
如何严谨地做性能测试
一般来说,性能测试要统一考虑这么几个因素:Thoughput吞吐量,Latency响应时间,资源利用(CPU/MEM/IO/Bandwidth…),成功率,系统稳定性。
下面的这些性能测试的方式基本上来源自我的老老东家汤森路透,一家做real-time的金融数据系统的公司。
一,你得定义一个系统的响应时间latency,建议是TP99,以及成功率。比如路透的定义:99.9%的响应时间必需在1ms之内,平均响应时间在1ms以内,100%的请求成功。
二,在这个响应时间的限制下,找到最高的吞吐量。测试用的数据,需要有大中小各种尺寸的数据,并可以混合。最好使用生产线上的测试数据。
三,在这个吞吐量做Soak Test,比如:使用第二步测试得到的吞吐量连续7天的不间断的压测系统。然后收集CPU,内存,硬盘/网络IO,等指标,查看系统是否稳定,比如,CPU是平稳的,内存使用也是平稳的。那么,这个值就是系统的性能
四,找到系统的极限值。比如:在成功率100%的情况下(不考虑响应时间的长短),系统能坚持10分钟的吞吐量。
五,做Burst Test。用第二步得到的吞吐量执行5分钟,然后在第四步得到的极限值执行1分钟,再回到第二步的吞吐量执行5钟,再到第四步的权限值执行1分钟,如此往复个一段时间,比如2天。收集系统数据:CPU、内存、硬盘/网络IO等,观察他们的曲线,以及相应的响应时间,确保系统是稳定的。
六、低吞吐量和网络小包的测试。有时候,在低吞吐量的时候,可能会导致latency上升,比如TCP_NODELAY的参数没有开启会导致latency上升(详见TCP的那些事),而网络小包会导致带宽用不满也会导致性能上不去,所以,性能测试还需要根据实际情况有选择的测试一下这两咱场景。
(注:在路透,路透会用第二步得到的吞吐量乘以66.7%来做为系统的软报警线,80%做为系统的硬报警线,而极限值仅仅用来扛突发的peak)
是不是很繁锁?是的,只因为,这是工程,工程是一门科学,科学是严谨的。
wrk
介绍
- wrk 是一个类似 ab(apache bench)、jmeter 的压力测试工具,官方称它为:现代的 HTTP 基准测试工具
用 C 编写的 HTTP 协议压测工具
- 底层基于 epoll 和 kqueue 实现,使用了多线程和多路复用 IO(非阻塞 IO),利用异步的事件驱动框架,通过很少的线程就可以压出很大的并发量
- 降低测试工具本身性能开销对测试结果准确性的影响
- 支持使用 LuaJIT 脚本,可以执行 HTTP 请求生成、响应处理和自定义报告
它的定位
- 轻量级性能测试工具
- 仅支持 HTTP 协议
- 仅支持单机压测,多机器压测需要每个机器都手动执行一次 wrk 命令
- 不可取代 Jmeter、LR 等专业性能工具
官方 Tips
- 运行 wrk 的机器必须有足够数量的临时端口可用,关闭的 socket 必须快速回收
- 仅更改 HTTP 方法、路径、添加请求头或正文的用户脚本不会对性能产生影响
- 每个请求的操作,特别是构建新的 HTTP 请求,以及 response() 的使用将必然减少可以生成的负载量
架构
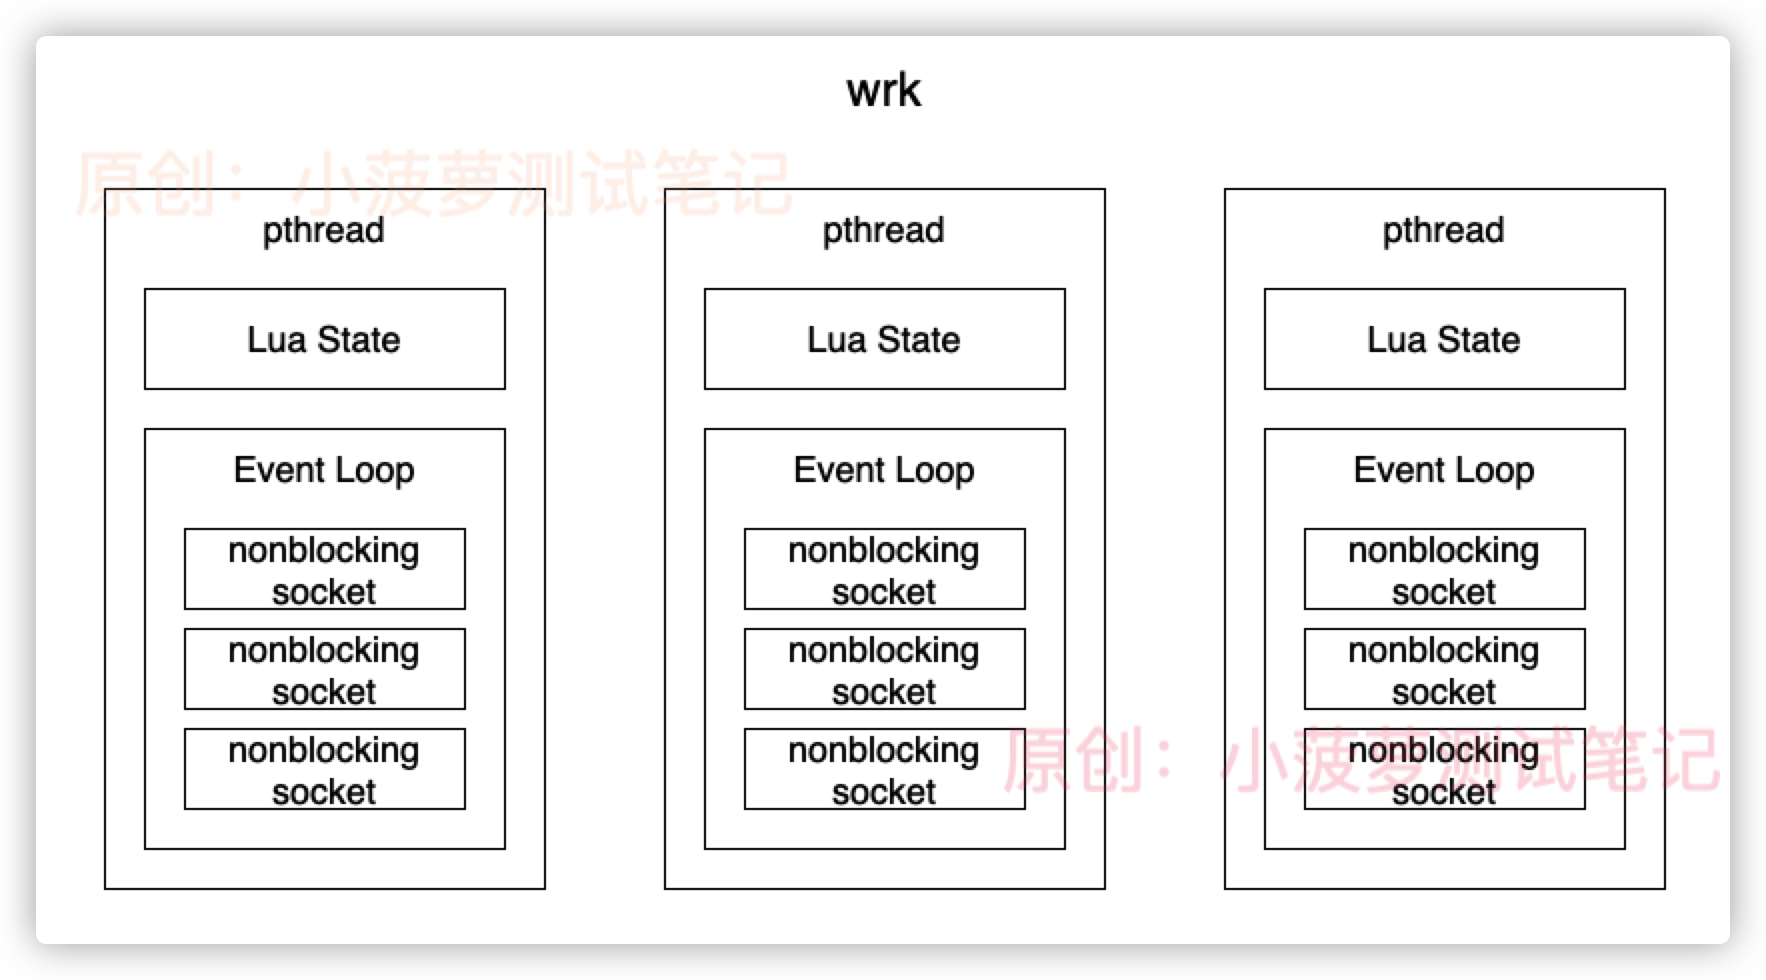
- 在 wrk 里面,每个线程都有自己独立的 Lua 虚拟机和 Event Loop
- 通过命令行参数 -c 指定的连接数,会平均分给所有线程,每个新建的 socket,都会调用 fcntl 将其设置为 NONBLOCK,即非阻塞,然后托管给 Event Loop
- 直接使用 redis 的 Event Loop 实现,适配了不同操作系统的实现
- 启动的时候,每个线程都会新建一个 Lua State,并调用 luaL_dofile 加载命令行参数 -s 指定的 lua 脚本文件
- 如果没有自定义的 lua 脚本,wrk 默认发送的是 HTTP 1.1 GET 请求,用长连接
基本用法
wrk 的安装非常简单,最直接的方式就是从 Github 上下载源代码然后 make 。
其单独无选项和参数运行的输出如下:
 1
 2
 3
 4
 5
 6
 7
 8
 9
10
11
12
13
14
|
Usage: wrk <options> <url>
  Options:
    -c, --connections <N>  Connections to keep open
    -d, --duration    <T>  Duration of test
    -t, --threads     <N>  Number of threads to use

    -s, --script      <S>  Load Lua script file
    -H, --header      <H>  Add header to request
        --latency          Print latency statistics
        --timeout     <T>  Socket/request timeout
    -v, --version          Print version details

  Numeric arguments may include a SI unit (1k, 1M, 1G)
  Time arguments may include a time unit (2s, 2m, 2h)
|
- -c 选项。同时保持打开的连接数,可以理解为并发数,一般在测试过程中,这个值需要使用者不断向上调试,直至 QPS 达到一个临界点,便可认为此时的并发数为系统所能承受的最大并发量;由于服务都有自身的负载极限,也会出现连接数越大QPS越低的情况,这种情况是因为连接数设置的过高,导致待测系统超出自身能承受的负载。
- -d 选项。测试的时长;wrk 在开始执行指定的测试计划之后,会启动一个或多个工作线程分别开始在连接上发送请求接收响应,主线程会等待工作线程固定的时间,这个时间就是测试的时长 -d。
- -t 选项。测试的并发线程数;wrk 在开始执行指定的测试计划之后,会启动指定数量的工作线程分别开始在连接上发送请求接收响应,每个工作线程会非阻塞地在多个连接上工作固定的时间;每个线程的连接数由 -c 指定的值除以并发线程数确定;每个线程的工作时长由 -d 指定的值确定。一般是依据CPU核数来设定,最大值不要超过2倍CPU核数。
- -s 选项。可以使用 Lua 来扩展测试计划,这需要了解 wrk 的 Lua 扩展点。
- -H 选项。可以在每一个 HTTP 请求中添加上自定义的请求头,比如 “Host: a.b.c.org”。
- –latency 选项。不填加此选项,则压测的结果会比较简单;添加此选项之后,压测的结果中会包含请求延时百分位信息。
- –timeout 选项。每个请求的超时设置。
- -v 选项。输出当前 wrk 的版本信息并退出。
实际上,线程数和并发数没有直接关系,wrk 会为每个线程分配(c/t)个 socket 连接.每个连接会先执行请求动作,然后等待直到收到响应后才会再发送请求,所以每个时间点的并发数大致等于连接数(connection).所以这里要注意-c和-t连接数和参数的设置,一个线程只能占用一个cpu核,如果还没到cpu的瓶颈,决定qps的是连接处和瓶颈响应时间,举个例子,如果只有一个线程,链接数10,平均响应时间10ms,那么一个链接一秒能过100个请求,所以总共能压出1000qps。当cpu到瓶颈后,不管怎么去调大连接数qps都不会上去,这个时候就需要考虑调大线程数了,利用多核心的资源提升qps。
一般线程数不宜过多,核数的2到4倍足够了,多了反而因为线程切换过多造成效率降低,因为 wrk 不是使用每个连接一个线程的模型,而是通过异步网络 io 提升并发量,所以网络通信不会阻塞线程执行,这也是 wrk 可以用很少的线程模拟大量网路连接的原因。而现在很多性能工具并没有采用这种方式,而是采用提高线程数来实现高并发。所以并发量一旦设的很高,测试机自身压力就很大。测试效果反而下降。
wrk使用了多路复用的技术。多路复用使得用一个线程可以异步发起很多个请求,所以不太好用线程数来控制请求数。但一个http连接同时只能处理一个请求,所以可以按一次请求的latency估算出一个连接可以承载的qps数,调整连接数即可控制压测请求大小qps = 1000/latency * Connectnum。 这里需要注意的是单个线程只能占用一个cpu核心,当cpu到瓶颈时也可能压不上去,需要调整线程数。
另外一个方法,把连接数设置的非常大,让连接数不再是发压的瓶颈,然后调整脚本中的delayTime和线程数,可以精确控制qps。 qps = 1000/delayTime * threadnum
综上,常用的 wrk 命令行如下:
1
|
./wrk -c 100 -d 60s -t 16 --latency <http://127.0.0.1:1993/instant>
|
输出结果
命令 ./wrk -c 1700 -d 60s -t 16 --latency <http://127.0.0.1:1993/instant> 的典型输出结果如下:
 1
 2
 3
 4
 5
 6
 7
 8
 9
10
11
12
13
14
|
(01) Running 1m test @ <http://127.0.0.1:1993/instant> //
(02)   16 threads and 1700 connections
(03)   Thread Stats   Avg      Stdev     Max   +/- Stdev
(04)     Latency    28.51ms   11.92ms 688.79ms   96.20%
(05)     Req/Sec     3.65k   542.74    14.77k    87.77%
(06)   Latency Distribution
(07)      50%   27.86ms
(08)      75%   29.95ms
(09)      90%   32.71ms
(10)      99%   46.93ms
(11)   3491898 requests in 1.00m, 272.70MB read
(12)   Socket errors: connect 0, read 0, write 0, timeout 435
(13) Requests/sec:  58184.19
(14) Transfer/sec:      4.54MB
|
- 第 1 行和第 2 行简要说明了测试计划的情况和参数选项信息。
- 第 3/4/5 行是线程级别的测试统计结果,包括请求延时(从请求发出到收到响应的耗时)的平均值、标准差、最大值、平均值正负一个标准差范围内的请求占比和每秒请求数(QPS)的对应值。
- 第 6/7/8/9/10 行是请求延时的百分位统计,分别有 TP50/TP75/TP90/TP99。
- 第 11/12 行是测试结果的总体信息,如果有的话还会包含 HTTP 的响应不是 20x 的返回码的数据。
- 第 13 行是总的 QPS。
- 第 14 行是总的传输数据量。
标准差啥意思?标准差如果太大说明样本本身离散程度比较高,有可能系统性能波动较大。
比较重要的部分是 Thread Stats & Latency Distribution & Socket errors。
Thread Stats
线程级别的统计输出了请求延时和每秒请求数的平均值、最大值和标准差等信息。
1
2
3
4
5
6
7
|
typedef struct {
    uint64_t count;
    uint64_t limit;
    uint64_t min;
    uint64_t max;
    uint64_t data[];
} stats;
|
统计采样数据存储在一个巨大的数组 data 来存放统计数据。每得到一个采样数据之后,该采样数据被放入数组中,对 count 加一,并且同步更新 min 和 max 的值。由于采样是在多个线程并发进行,所以对上述数据值的更新都是采用了原子操作保护的。
数组的索引是采样值(请求延时即微秒数,请求数即每100毫秒请求数的1000倍),值是相同采样值重复的次数。
1
2
3
4
5
6
7
|
-------------------------------------------------

| 0 | ... |  101 | ... | 135 | ... |  501 | ... |
-------------------------------------------------

| 0 | ... | 2050 | ... |  71 | ... | 1049 | ... |
-------------------------------------------------
|
上述的数组第一行是索引,第二行是数值。可能表示的是请求延时的采样,延时为 101us 的请求数有 2050 次,135us 的 71 次,501us 的 1049 次。
在程序初始化时,请求延时对应的采样数组被初始化为请求超时时长的毫秒数(–timeout 选项指定值,或 2000s 的默认值),请求数对应初始化为 10000000。
所以,Latency 行和 Req/Sec 行的数据分别通过计算上述数据结构的对应值(均值、标准差等)得到。
Latency Distribution
延时分布即请求延时的百分位 Percentile 信息,包括 TP50/TP75/TP90/TP99。
Socket Errors
做性能测试时,需要得到的是在 HTTP 服务返回正确数据的情况下的极限能力;所以,每一次性能测试需要关注请求错误,包括连接失败、读失败、写失败、请求超时、返回码不符合预期等。
“Req/Sec” VS “Requests/sec”
在 wrk 的输出中,有两个地方显示的是压测的 QPS: 第 5 行 “Req/Sec” 和 第 13 行 “Requests/sec”。
如上所述,“Req/Sec” 是线程采样数据的统计结果:多个线程分别每 100ms 收集一次累积的请求响应数,该值乘以 1000 放入统计数组中参与最终的统计;假若程序总的 1s 中的请求响应数是 1000,线程数是 4,则统计数组中会出现 4 x 10 = 40 个采样,“Req/Sec” 是这 40 个采样的统计结果(如均值)。
而 “Requests/sec” 是简单地将所有的请求响应数除以测试时长,按前一段的描述应该得到 1000。
所以,基本上 “Req/Sec” 的值是 “Requests/sec” 值除以线程数;但由于采样误差和其他原因,二者的值会有一个差值存在,不是严格相等。
Coordinated Omission
Coordinated Omission 是性能测试中的一个陷阱,在 Your Load Generator is Probably Lying to You - Take the Red Pill and Find Out Why 和 七层网络性能基准测试中的协调遗漏问题–Coordinated Omission 中有详细介绍。
简单地说,在性能测试中会有两种情况造成测试得到的请求延时数据不能反应真实的情况。
当测试计划中请求的间隔小于单次请求耗时时,会造成后续的请求会等待被发送。由于 HTTP 是请求响应模型,同一个连接内只有当前一个请求的响应收到之后才能继续发送新的请求,所以如果计划 1s 之内要发送 10 个请求,也就是请求 1 被发送之后 100ms 就需要发送请求 2;但是请求 1 对应的响应 1 过了 150ms 才收到,所以实际上请求 2 在第 150ms 才被发出去;如果再过 150ms 之后请求 2 的响应才收到,则参与统计的采样是请求 1 对应的延时 150ms 和 请求 2 对应的延时 150ms;这看上去很合理,但是如果考虑到实际上请求 2 等待了 50ms 才发送请求的话,请求 2 的延时应该是 200ms。距离来说的话,就是你去麦当劳排队买东西,你买东西的耗时应该是你排队的时间加上店员处理你的订单的时间;如果排队超过 10 分钟,你可能就会不耐烦,尽管有可能店员给你拿一个汉堡你再付钱总共不超过 30s。
当测试计划被其他因素影响,导致请求的延时中包含了其他部分的耗时,比如进程调度或作业挂起等导致的睡眠时间。
wrk 已经于 2015 年添加了对 Coordinated Omission 的修正。
wrk2
wrk2是一个主要基于wrk的HTTP基准测试工具,wrk2经过修改后能够提供稳定的吞吐量负载以及更精确的延时统计,即通过设置参数,wrk2增加了–rate或-R参数设置吞吐量(每秒总请求数)及–u_latency参数显示延时统计。
基本用法
wrk2 的安装也非常简单,最直接的方式就是从 Github 上下载源代码然后 make -j8,其编译出来的二进制程序名,如果不特别指定的话,也是 wrk。
其单独无选项和参数运行的输出如下:
 1
 2
 3
 4
 5
 6
 7
 8
 9
10
11
12
13
14
15
16
17
18
19
20
21
22
|
Usage: wrk <options> <url>
  Options:
    -c, --connections <N>  Connections to keep open
    -d, --duration    <T>  Duration of test
    -t, --threads     <N>  Number of threads to use

    -s, --script      <S>  Load Lua script file
    -H, --header      <H>  Add header to request
    -L  --latency          Print latency statistics
    -U  --u_latency        Print uncorrected latency statistics
        # 设置请求超时时间,大于该时间的请求将被记录==
        --timeout     <T>  Socket/request timeout
    -B, --batch_latency    Measure latency of whole
                           batches of pipelined ops
                           (as opposed to each op)
    -v, --version          Print version details
    -R, --rate        <T>  work rate (throughput)
                           in requests/sec (total)
                           [Required Parameter]

  Numeric arguments may include a SI unit (1k, 1M, 1G)
  Time arguments may include a time unit (2s, 2m, 2h)
|
参数选项基本同 wrk。
- -L 选项。输出经 HDR 直方图增强后的延时分布信息。打印详细延迟统计
- -U 选项。输出经 HDR 直方图增强后的延时分布信息,与 -L 选项不同的是输出未修正 Coordinated Omission 的延时数据。
- -R 选项。吞吐率,每个线程每秒完成的请求数,这个数值是wrk2必带的一个参数,在测试过程中也是需要测试人员多次调试,通过不断上调其数值,测试出QPS的临界值及保证服务可用的时延。。
与 wrk 不同的是,wrk2 在执行测试计划时需要指定期望的负载,而不是尽全力产生最大的负载。
输出结果
命令 ./wrk -c 300 -d 60s -t 16 -R 1200 --latency <http://127.0.0.1:1993/instant> 的典型输出结果如下:
  1
  2
  3
  4
  5
  6
  7
  8
  9
 10
 11
 12
 13
 14
 15
 16
 17
 18
 19
 20
 21
 22
 23
 24
 25
 26
 27
 28
 29
 30
 31
 32
 33
 34
 35
 36
 37
 38
 39
 40
 41
 42
 43
 44
 45
 46
 47
 48
 49
 50
 51
 52
 53
 54
 55
 56
 57
 58
 59
 60
 61
 62
 63
 64
 65
 66
 67
 68
 69
 70
 71
 72
 73
 74
 75
 76
 77
 78
 79
 80
 81
 82
 83
 84
 85
 86
 87
 88
 89
 90
 91
 92
 93
 94
 95
 96
 97
 98
 99
100
101
102
103
104
105
106
107
108
109
110
111
112
113
114
115
116
117
118
119
120
121
122
123
124
125
126
127
128
|
Running 1m test @ <http://10.145.67.20:8080/entry/rest0>
  16 threads and 300 connections
  Thread calibration: mean lat.: 1.816ms, rate sampling interval: 10ms
  Thread calibration: mean lat.: 1.759ms, rate sampling interval: 10ms
  Thread calibration: mean lat.: 1.794ms, rate sampling interval: 10ms
  Thread calibration: mean lat.: 1.802ms, rate sampling interval: 10ms
  Thread calibration: mean lat.: 1.804ms, rate sampling interval: 10ms
  Thread calibration: mean lat.: 1.814ms, rate sampling interval: 10ms
  Thread calibration: mean lat.: 1.788ms, rate sampling interval: 10ms
  Thread calibration: mean lat.: 1.775ms, rate sampling interval: 10ms
  Thread calibration: mean lat.: 1.794ms, rate sampling interval: 10ms
  Thread calibration: mean lat.: 1.808ms, rate sampling interval: 10ms
  Thread calibration: mean lat.: 1.804ms, rate sampling interval: 10ms
  Thread calibration: mean lat.: 1.807ms, rate sampling interval: 10ms
  Thread calibration: mean lat.: 1.816ms, rate sampling interval: 10ms
  Thread calibration: mean lat.: 1.796ms, rate sampling interval: 10ms
  Thread calibration: mean lat.: 1.771ms, rate sampling interval: 10ms
  Thread calibration: mean lat.: 1.741ms, rate sampling interval: 10ms
  Thread Stats   Avg      Stdev     Max   +/- Stdev # 平均值 标准差 最大值 正负一个标准差所占的比例
    Latency     1.84ms    1.24ms  43.68ms   98.54%  # 延迟
    Req/Sec    77.48    100.86   777.00     66.65%  # 处理中的请求数
  Latency Distribution (HdrHistogram - Recorded Latency) # 延迟分布
 50.000%    1.73ms
 75.000%    2.01ms
 90.000%    2.32ms
 99.000%    3.86ms
 99.900%   20.09ms  # 99分位的延迟
 99.990%   29.93ms
 99.999%   40.51ms
100.000%   43.71ms

  Detailed Percentile spectrum:
       Value   Percentile   TotalCount 1/(1-Percentile)

       0.813     0.000000            1         1.00
       1.192     0.100000         5995         1.11
       1.356     0.200000        11983         1.25
       1.493     0.300000        18014         1.43
       1.616     0.400000        23995         1.67
       1.734     0.500000        29979         2.00
       1.789     0.550000        32932         2.22
       1.847     0.600000        35990         2.50
       1.899     0.650000        38931         2.86
       1.954     0.700000        41939         3.33
       2.013     0.750000        44904         4.00
       2.049     0.775000        46407         4.44
       2.089     0.800000        47925         5.00
       2.135     0.825000        49438         5.71
       2.185     0.850000        50902         6.67
       2.247     0.875000        52424         8.00
       2.279     0.887500        53144         8.89
       2.317     0.900000        53888        10.00
       2.361     0.912500        54648        11.43
       2.407     0.925000        55396        13.33
       2.463     0.937500        56132        16.00
       2.499     0.943750        56512        17.78
       2.535     0.950000        56888        20.00
       2.579     0.956250        57263        22.86
       2.629     0.962500        57636        26.67
       2.691     0.968750        58010        32.00
       2.727     0.971875        58195        35.56
       2.769     0.975000        58377        40.00
       2.821     0.978125        58563        45.71
       2.891     0.981250        58752        53.33
       3.013     0.984375        58940        64.00
       3.119     0.985938        59032        71.11
       3.279     0.987500        59125        80.00
       3.621     0.989062        59219        91.43
       4.123     0.990625        59311       106.67
       5.139     0.992188        59405       128.00
       5.947     0.992969        59453       142.22
       7.071     0.993750        59498       160.00
       8.367     0.994531        59545       182.86
      10.527     0.995313        59592       213.33
      12.343     0.996094        59639       256.00
      12.999     0.996484        59662       284.44
      13.879     0.996875        59685       320.00
      14.839     0.997266        59710       365.71
      15.943     0.997656        59733       426.67
      17.007     0.998047        59757       512.00
      17.519     0.998242        59767       568.89
      17.999     0.998437        59779       640.00
      18.511     0.998633        59792       731.43
      19.279     0.998828        59802       853.33
      20.367     0.999023        59814      1024.00
      20.687     0.999121        59820      1137.78
      21.215     0.999219        59826      1280.00
      22.751     0.999316        59832      1462.86
      23.583     0.999414        59837      1706.67
      24.095     0.999512        59843      2048.00
      25.231     0.999561        59846      2275.56
      26.159     0.999609        59849      2560.00
      26.527     0.999658        59852      2925.71
      26.895     0.999707        59855      3413.33
      27.343     0.999756        59858      4096.00
      27.791     0.999780        59859      4551.11
      28.767     0.999805        59861      5120.00
      28.895     0.999829        59862      5851.43
      29.439     0.999854        59864      6826.67
      29.519     0.999878        59865      8192.00
      29.935     0.999890        59866      9102.22
      33.567     0.999902        59867     10240.00
      33.567     0.999915        59867     11702.86
      36.991     0.999927        59868     13653.33
      38.047     0.999939        59869     16384.00
      38.047     0.999945        59869     18204.44
      39.871     0.999951        59870     20480.00
      39.871     0.999957        59870     23405.71
      39.871     0.999963        59870     27306.67
      40.511     0.999969        59871     32768.00
      40.511     0.999973        59871     36408.89
      40.511     0.999976        59871     40960.00
      40.511     0.999979        59871     46811.43
      40.511     0.999982        59871     54613.33
      43.711     0.999985        59872     65536.00
      43.711     1.000000        59872          inf

 [Mean    =        1.836, StdDeviation   =        1.244]

 [Max     =       43.680, Total count    =        59872]

 [Buckets =           27, SubBuckets     =         2048]

----------------------------------------------------------

  72016 requests in 1.00m, 5.62MB read
Requests/sec:   1200.22 # 平均每秒处理完成1200.22个请求
Transfer/sec:     95.91KB # 平均每秒读取数据95.91KB
|
与 wrk 的输出相比,wrk2 的输出多了一些内容:
- “Thread calibration” 显示了 10s 的线程预热/修正的数据。
- “Latency Distribution” 部分多了 TP999/TP9999/TP99999/TP100 的数据。
- “Detailed Percentile spectrum” 显示了详细的百分位图谱。
综上,如果需要在相同并发度下使用不同的吞吐量QPS对 HTTP 服务进行压测,又或者需要获取更精确的 TP999/TP9999 百分位数据,可以考虑使用 wrk2 代替 wrk 进行性能测试。
我的一个性能测试实践是先使用 wrk 找到一个符合基本要求的并发读(-c 选项)和对应的QPS,然后以这个QPS为上限使用 wrk2 在相同并发度的基础上测试不同吞吐量(-R 选项)下的请求延时。
lua脚本
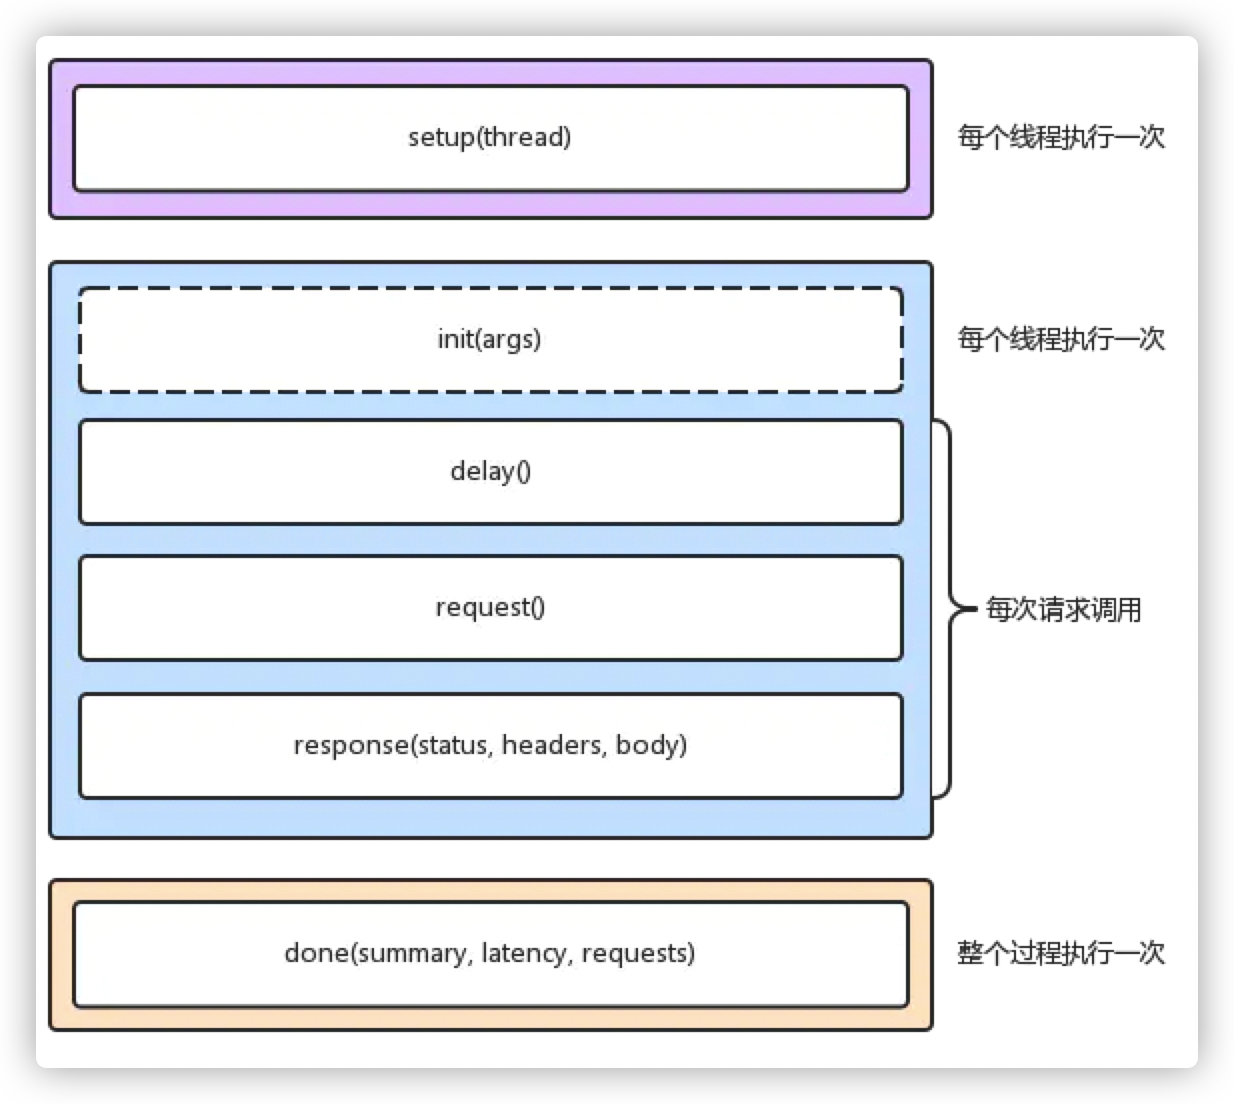
三阶段
在wrk中是通过自定义相应的lua方法达到改变wrk行为的目的,wrk的执行分为三个阶段:启动阶段(setup)、运行阶段(running)、结束阶段(done),每个测试线程,都拥有独立的lua 运行环境。
启动阶段
function setup(thread)是有参数传入的,传入的内容就是当前的线程,setup是在ip地址解析后并且所有线程初始化后,但没用启动前执行的,所以这个时候你可以对thread的构造做一些自定义。
在脚本文件中实现 setup 方法,wrk 就会在测试线程已经初始化,但还没有启动的时候调用该方法。wrk会为每一个测试线程调用一次 setup 方法,并传入代表测试线程的对象thread 作为参数。setup 方法中可操作该thread 对象,获取信息、存储信息、甚至关闭该线程。
这里一般做一些初始化的工作,例如读取配置文件,加载到内存(不要每次请求的时候读取一遍,这样对测试准确性影响很大)
thread 的一些方法和变量
1
2
3
4
|
thread.addr             - get or set the thread's server address,获取或设置服务器地址信息
thread:get(name)        - get the value of a global in the thread's env,获取当前线程参数
thread:set(name, value) - set the value of a global in the thread's env,设置当前线程参数
thread:stop()           - stop the thread,终止线程
|
- 只有布尔值、nil值、数字和字符串值或相同的 table 可以通过 get() / set() 进行操作
- thread:stop() 只能在线程运行时被调用
运行阶段
1
2
3
4
|
function init(args)
function delay()
function request()
function response(status, headers, body)
|
- init(args):由测试线程调用,只会在进入运行阶段时,调用一次。支持从启动 wrk 的命令中,获取命令行参数,args 是通过命令行传入的参数,通过 – 指定
- delay():每次发送请求之前调用,可以在这里定制延迟时间,通过返回值(单位毫秒)如:return 1000,即延迟一秒
- request():每次发送请求调用,可以对每一次的请求做一些自定义的操作,但是不要在该方法中做耗时的操作,返回一个自定义的 HTTP 请求字符串
- response(status, headers, body):在每次收到一个响应时被调用,为提升性能,如果没有定义该方法,为了提升效率,那么wrk不会解析 headers 和 body,这样测试结果会更加准确(解析响应数据是客户端负责的,不能算到服务器处理时间里面)
- status:响应状态码
- headers:响应头
- body:响应体
官方建议
- 每次构建一个新的请求都很耗时耗资源
- 当测试高性能服务器时,建议在 init() 中预生成所有请求,并在 request() 中进行快速查找
实际使用
- 一般在request()会配合 wrk.format() 方法,动态创建请求
- 在request()不要执行耗时的代码,否则会影响测试结果准确性
function init(args)是在线程启动后调用,这里是可以传参数的,在启动命令后加-- arg1 arg2,你就可以在init里通过args[1], args[2]获取到arg1和arg2,举例如下。
1
|
> ./wrk https://www.baidu.com -c100 -t10 -d100s -- 10 20
|
1
2
3
4
|
function init(args)
    print(args[1])  -- 输出10
    print(args[2])  -- 输出20
end
|
所以这里可以通过这种方式定义更多的自定义参数,然后通过init(args)做解析,后续可以实现多的功能。
function delay()就很简单了,它是为了让你去控制请求发送的之间间隔,如果你想隔10ms发送一次请求,直接return 10就行了,通过delay()可以实现qps大小的控制。
function request()主要功能是为了定制每次请求的参数数据,如果你想构造一些复杂的请求,request()是不得不改的,你可以再request()中修改上文wrk 结构体中的所有值,基本上最长改动的就是wrk.header, wrk.path, wrk.body。这里需要注意,request()是要求有返回值的,其返回值是wrk.format(method, path, headers, body),wrk.format会将这些参数构造成一个http请求可用的请求数据。
function response(status, headers, body)是在每次wrk收到http请求响应后调用,wrk会将请求响应中的http status、headers和body作为参数传递进来,你可以通过这些参数信息做响应统计、调整压测流量、甚至停止压测……等比较自动化的操作。
结束阶段
1
|
function done(summary, latency, requests)
|
done()方法是在压测结束后wrk会调用一次,即便有多个线程也只调用一次。wrk会将压测过程中的统计信息通过参数传递给你,你可以挑其中有用的部分输出。也可以输出你在response()中自行统计的内容。
wrk已经为你提供了以下的统计信息:
 1
 2
 3
 4
 5
 6
 7
 8
 9
10
11
12
13
14
15
16
17
18
19
|
latency.min              -- 最小延迟
  latency.max              -- 最大延迟
  latency.mean             -- 平均延迟
  latency.stdev            -- 延迟的标准差
  latency:percentile(99.0) -- 99分位的延迟
  latency(i)               -- raw value and count

summary = {
  duration = N,  -- 运行的时间ms
  requests = N,  -- 总请求数
  bytes    = N,  -- 总过收到的字节数
  errors   = {
    connect = N, -- 链接错误数
    read    = N, -- socket数据读取出错数量
    write   = N, -- socket数据写入出错数量
    status  = N, -- http code 大于399的数量
    timeout = N  -- 超时请求的总数量
  }
}
|
变量传递
例一:
 1
 2
 3
 4
 5
 6
 7
 8
 9
10
11
12
13
14
15
16
17
18
19
20
21
22
23
24
25
26
27
28
29
30
31
32
33
34
35
|
-- 启动阶段 (每个线程执行一次)
function setup(thread)
   print("----------启动阶段----------------")
   print("setup",thread)
   print("setup",thread.addr)
end

-- 运行阶段 (该方法init每个线程执行一次)
function init(args)
   print("-----------运行阶段---------------")
   print("init",args)
end

-- 这个三个方法每个请求都会调用一次
function delay()
 print("delay")
 -- 设置延迟990ms
 return 990
end

function request()
  print("request")
  -- 这个方法必须要有返回,不然会出错
  return wrk.request()
end

function response(status, headers, body)
  print("response",status,headers)
end

-- 结束阶段
function done(summary, latency, requests)
   print("-----------结束阶段---------------")
  print("done",summary,latency,requests)
end
|
运行结果
 1
 2
 3
 4
 5
 6
 7
 8
 9
10
11
12
13
14
15
16
17
18
19
20
21
|
$ wrk -c 1 -t 1 -d 2 https://www.baidu.com -s test.lua
----------启动阶段----------------
setup   userdata: 0x0100913d20
setup   14.215.177.39:443
-----------运行阶段---------------
init    table: 0x0100984ba0
request
Running 2s test @ https://www.baidu.com
  1 threads and 1 connections
delay
request
response        200     table: 0x0100985170
delay
  Thread Stats   Avg      Stdev     Max   +/- Stdev
    Latency    41.23ms    0.00us  41.23ms  100.00%
    Req/Sec     0.00      0.00     0.00    100.00%
  1 requests in 2.08s, 15.34KB read
Requests/sec:      0.48
Transfer/sec:      7.39KB
-----------结束阶段---------------
done    table: 0x0100914ed8     userdata: 0x0100915060  userdata: 0x0100915168
|
从运行结果中可以看出,先是调用setup启动,然后进行init初始化,然后再调用request获取请求内容,在调用delay获取延迟时间,这里因为delay比较多,所以当response被调用后才开始第二轮
例二:
 1
 2
 3
 4
 5
 6
 7
 8
 9
10
11
12
13
14
15
16
17
18
19
20
21
22
23
24
25
26
27
28
29
30
31
32
33
34
35
36
|
local threads = {}

-- 启动阶段 (每个线程执行一次)
function setup(thread)
    print("----------启动阶段----------------")
    table.insert(threads,thread)
end

-- 运行阶段 (该方法init每个线程执行一次)
function init(args)
    print("-----------运行阶段---------------")
    print("init:threads中的元素个数:",#threads)
end

-- 这个三个方法每个请求都会调用一次
function delay()
  print("delay:threads中的元素个数:",#threads)
  -- 设置延迟990ms
  return 990
end

function request()
    -- 这个方法必须要有返回,不然会出错
    print("request:threads中的元素个数:",#threads)
    return wrk.request()
end

function response(status, headers, body)
    print("response:threads中的元素个数:",#threads)
end

-- 结束阶段
function done(summary, latency, requests)
    print("-----------结束阶段---------------")
    print("done:threads中的元素个数:",#threads)
end
|
例二运行结果
 1
 2
 3
 4
 5
 6
 7
 8
 9
10
11
12
13
14
15
16
17
18
19
|
$ wrk -c1 -t1 -d2 https://www.baidu.com -s test.lua
----------启动阶段----------------
-----------运行阶段---------------
init:threads中的元素个数:       0
request:threads中的元素个数:    0
Running 2s test @ https://www.baidu.com
  1 threads and 1 connections
delay:threads中的元素个数:      0
request:threads中的元素个数:    0
response:threads中的元素个数:   0
delay:threads中的元素个数:      0
  Thread Stats   Avg      Stdev     Max   +/- Stdev
    Latency    46.47ms    0.00us  46.47ms  100.00%
    Req/Sec     0.00      0.00     0.00    100.00%
  1 requests in 2.07s, 15.34KB read
Requests/sec:      0.48
Transfer/sec:      7.40KB
-----------结束阶段---------------
done:threads中的元素个数:       1
|
当一个局部变量table内部元素在启动阶段(setup)发生改变时,在运行阶段调用的方法是直接无法获取的,在结束阶段(done)是可以的
例三:
 1
 2
 3
 4
 5
 6
 7
 8
 9
10
11
12
13
14
15
16
17
18
19
20
21
22
23
24
25
26
27
28
29
30
31
32
33
34
35
36
37
38
39
40
41
42
|
local counter = 1
local threads = {}

-- 启动阶段 (每个线程执行一次)
function setup(thread)
    print("----------启动阶段----------------")
    table.insert(threads,thread)
end

-- 运行阶段 (该方法init每个线程执行一次)
function init(args)
    print("-----------运行阶段---------------")
    print("init:threads中的元素个数:",#threads)
    counter = 222
end

-- 这个三个方法每个请求都会调用一次
function delay()
  -- 设置延迟990ms
  print("delay:threads中的元素个数:",#threads)
  print("delay:counter:",counter)
  return 990
end

function request()
    -- 这个方法必须要有返回,不然会出错
    print("request:threads中的元素个数:",#threads)
    print("requset:counter:",counter)
    return wrk.request()
end

function response(status, headers, body)
    print("response:threads中的元素个数:",#threads)
    print("response:counter:",counter)
end

-- 结束阶段
function done(summary, latency, requests)
    print("-----------结束阶段---------------")
    print("done:threads中的元素个数:",#threads)
    print("done:counter:",counter)
end
|
例三运行结果
 1
 2
 3
 4
 5
 6
 7
 8
 9
10
11
12
13
14
15
16
17
18
19
20
21
22
23
24
25
|
$ wrk -c1 -t1 -d2 https://www.baidu.com -s test.lua
----------启动阶段----------------
-----------运行阶段---------------
init:threads中的元素个数:       0
request:threads中的元素个数:    0
requset:counter:        222
Running 2s test @ https://www.baidu.com
  1 threads and 1 connections
delay:threads中的元素个数:      0
delay:counter:  222
request:threads中的元素个数:    0
requset:counter:        222
response:threads中的元素个数:   0
response:counter:       222
delay:threads中的元素个数:      0
delay:counter:  222
  Thread Stats   Avg      Stdev     Max   +/- Stdev
    Latency    44.94ms    0.00us  44.94ms  100.00%
    Req/Sec     0.00      0.00     0.00    100.00%
  1 requests in 2.06s, 15.34KB read
Requests/sec:      0.48
Transfer/sec:      7.43KB
-----------结束阶段---------------
done:threads中的元素个数:       1
done:counter:   1
|
同样在运行阶段对局部变量的改变也在结束阶段获取不到
例四:
 1
 2
 3
 4
 5
 6
 7
 8
 9
10
11
12
13
14
15
16
17
18
19
20
21
22
23
24
25
26
27
28
29
30
31
32
33
34
35
36
37
38
39
40
41
42
43
44
|
local counter = 1
local threads = {}

-- 启动阶段 (每个线程执行一次)
function setup(thread)
    print("----------启动阶段----------------")
    table.insert(threads,thread)
    print("setup:thrads地址:",threads)
    counter = 111
end

-- 运行阶段 (该方法init每个线程执行一次)
function init(args)
    print("-----------运行阶段---------------")
    print("init:threads中的元素个数:",#threads,threads)
    counter = 222
end

-- 这个三个方法每个请求都会调用一次
function delay()
  -- 设置延迟990ms
  print("delay:threads中的元素个数:",#threads,threads)
  print("delay:counter:",counter)
  return 990
end

function request()
    -- 这个方法必须要有返回,不然会出错
    print("request:threads中的元素个数:",#threads,threads)
    print("requset:counter:",counter)
    return wrk.request()
end

function response(status, headers, body)
    print("response:threads中的元素个数:",#threads,threads)
    print("response:counter:",counter)
end

-- 结束阶段
function done(summary, latency, requests)
    print("-----------结束阶段---------------")
    print("done:threads中的元素个数:",#threads,threads)
    print("done:counter:",counter)
end
|
例四运行结果
 1
 2
 3
 4
 5
 6
 7
 8
 9
10
11
12
13
14
15
16
17
18
19
20
21
22
23
24
25
26
|
$ wrk -c1 -t1 -d2 https://www.baidu.com -s test.lua
----------启动阶段----------------
setup:thrads地址:       table: 0x01032abe30
-----------运行阶段---------------
init:threads中的元素个数:       0       table: 0x010331be30
request:threads中的元素个数:    0       table: 0x010331be30
requset:counter:        222
Running 2s test @ https://www.baidu.com
  1 threads and 1 connections
delay:threads中的元素个数:      0       table: 0x010331be30
delay:counter:  222
request:threads中的元素个数:    0       table: 0x010331be30
requset:counter:        222
response:threads中的元素个数:   0       table: 0x010331be30
response:counter:       222
delay:threads中的元素个数:      0       table: 0x010331be30
delay:counter:  222
  Thread Stats   Avg      Stdev     Max   +/- Stdev
    Latency    44.77ms    0.00us  44.77ms  100.00%
    Req/Sec     0.00      0.00     0.00    100.00%
  1 requests in 2.05s, 15.34KB read
Requests/sec:      0.49
Transfer/sec:      7.48KB
-----------结束阶段---------------
done:threads中的元素个数:       1       table: 0x01032abe30
done:counter:   111
|
从运行结果发现其实改变无法察觉是因为他们并不是同一个变量,结束阶段打印的threads地址和运行阶段打印的地址是不一样的,但是启动阶段和结束阶段是一样的
将例四中的threads变量改为全局变量后运行
 1
 2
 3
 4
 5
 6
 7
 8
 9
10
11
12
13
14
15
16
17
18
19
20
21
22
|
$ wrk -c1 -t1 -d2 https://www.baidu.com -s test.lua
----------启动阶段----------------
setup:thrads地址:       table: 0x01025bbe30
-----------运行阶段---------------
init:threads中的元素个数:       0       table: 0x010261be30
request:threads中的元素个数:    0       table: 0x010261be30
requset:counter:        222
Running 2s test @ https://www.baidu.com
  1 threads and 1 connections
delay:threads中的元素个数:      0       table: 0x010261be30
delay:counter:  222
request:threads中的元素个数:    0       table: 0x010261be30
requset:counter:        222
  Thread Stats   Avg      Stdev     Max   +/- Stdev
    Latency     0.00us    0.00us   0.00us     nan%
    Req/Sec     0.00      0.00     0.00       nan%
  0 requests in 2.04s, 0.00B read
Requests/sec:      0.00
Transfer/sec:       0.00B
-----------结束阶段---------------
done:threads中的元素个数:       1       table: 0x01025bbe30
done:counter:   111
|
运行结果是一样的,这里我得出一个结论,前面说每个测试线程,都拥有独立的lua 运行环境,这个独立的环境是运行阶段用不同的线程体现,首先是有一个主线程获取命令行中的参数信息,然后解析-t 1后得知要创建一个线程thread,让后会创建一个线程在主线程中将创建的线程thread传入到以主线程环境的setup,当时间-d过了,主线程被唤醒,主线程关闭创建的线程,然后在主线程环境中执行 done方法,因为setup和done都是在主线环境中执行,线程上下文一样所以共享全局和外部定义的局部变量。
如何传递这些变量?这就轮到上面说过的thread:set和thread:get上场了,这两个方法分别是在主线程中将值设置给指定线程中的全局变量池中,用法如下例:
 1
 2
 3
 4
 5
 6
 7
 8
 9
10
11
12
13
14
15
16
17
18
19
20
21
22
23
24
25
26
27
28
29
30
31
32
33
34
35
36
37
38
39
|
local counter = 1
local threads = {}
-- 启动阶段 (每个线程执行一次)
function setup(thread)
   local counter = 1
   table.insert(threads,thread)
   thread:set("counter",counter)
end

-- 运行阶段 (该方法init每个线程执行一次)
function init(args)
    print("-----------运行阶段---------------")
    counter = 111
end

-- 这个三个方法每个请求都会调用一次
function delay()
  -- 设置延迟990ms
  print("delay:counter:",counter)
  return 990
end

function request()
    -- 这个方法必须要有返回,不然会出错
    print("requset:counter:",counter)
    return wrk.request()
end

function response(status, headers, body)
    print("response:counter:",counter)
end

-- 结束阶段
function done(summary, latency, requests)
    print("-----------结束阶段---------------")
    local thread = threads[1]
    local counter = thread:get("counter")
    print("done:counter:",counter)
end
|
传递运行结果
 1
 2
 3
 4
 5
 6
 7
 8
 9
10
11
12
13
14
15
|
$ wrk -c1 -t1 -d2 https://www.baidu.com -s test.lua
-----------运行阶段---------------
requset:counter:        111
Running 2s test @ https://www.baidu.com
  1 threads and 1 connections
delay:counter:  111
requset:counter:        111
  Thread Stats   Avg      Stdev     Max   +/- Stdev
    Latency     0.00us    0.00us   0.00us     nan%
    Req/Sec     0.00      0.00     0.00       nan%
  0 requests in 2.05s, 0.00B read
Requests/sec:      0.00
Transfer/sec:       0.00B
-----------结束阶段---------------
done:counter:   1
|
那么问题来了,我们如何对多个线程进行同步呢?thread:set是有局限性的,不支持function和thread的传递.
 1
 2
 3
 4
 5
 6
 7
 8
 9
10
11
12
13
14
15
16
17
18
19
20
21
22
23
24
25
26
27
28
29
30
31
32
33
34
35
36
37
38
39
40
41
|
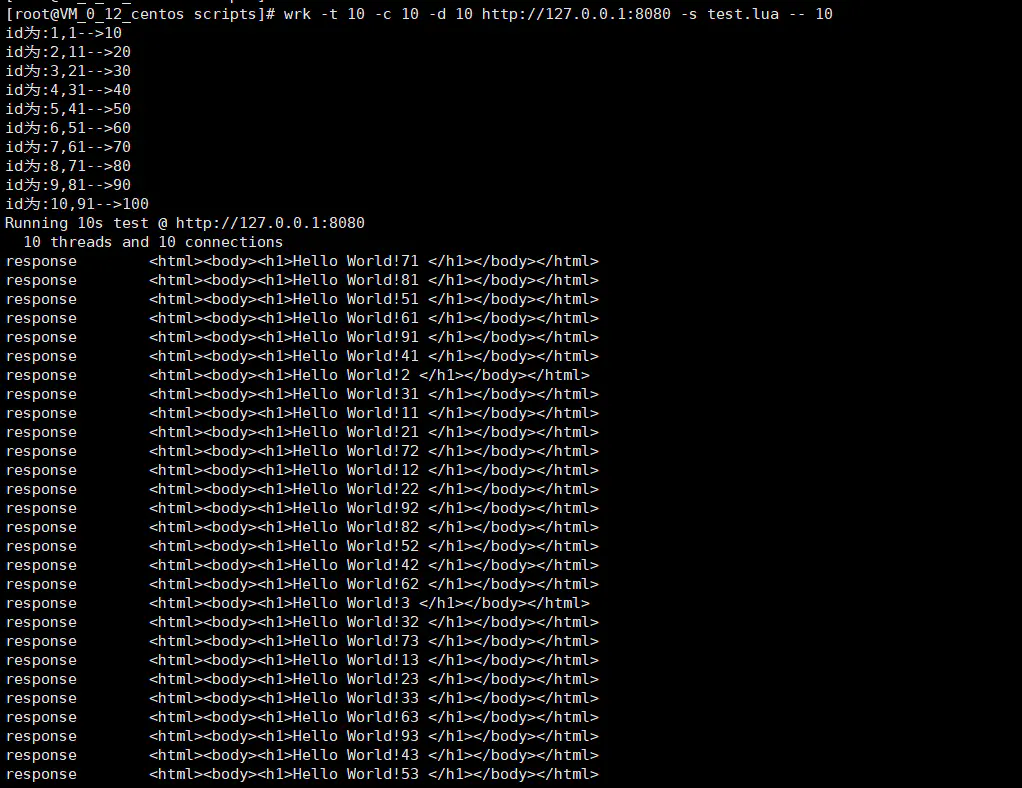
function init(args)
    threadCount = args[1]
    local passes = getPass()
    local len = #passes / threadCount
    local startIdx = len * (id - 1) + 1
    local endIdx
    if threadCount == id then
        endIdx = #passes
    else
        endIdx = startIdx + len - 1
    end

    print(string.format("id为:%s,%d-->%d",id,startIdx,endIdx))
    co = coroutine.create(
       function()
          for i = startIdx,endIdx do
              coroutine.yield(passes[i])
          end
       end
    )
end

function delay()
  return 990
end

function request()
    local status,i = coroutine.resume(co)
    if not i then

      wrk.thread:stop()
      return
    end
    local path = "/?query="..i
    return wrk.format(nil,path)

end

function response(status, headers, body)
    print("response",body)
end
|
结果如下:
自定义Lua脚本中可访问的变量以及方法
变量:wrk
 1
 2
 3
 4
 5
 6
 7
 8
 9
10
|
wrk = {
    scheme  = "http",
    host    = "localhost",
    port    = 8080,
    method  = "GET",
    path    = "/",
    headers = {},
    body    = nil,
    thread  = <userdata>,
  }
|
以上定义了一个table类型的全局变量,修改该wrk变量,会影响所有请求。
方法:
-
wrk.fomat
-
wrk.lookup
-
wrk.connect
上面三个方法解释如下:
 1
 2
 3
 4
 5
 6
 7
 8
 9
10
11
12
13
14
15
16
17
|
function wrk.format(method, path, headers, body)

    wrk.format returns a HTTP request string containing the passed parameters
    merged with values from the wrk table.
    # 根据参数和全局变量 wrk,生成一个 HTTP rquest 字符串。

function wrk.lookup(host, service)

    wrk.lookup returns a table containing all known addresses for the host
    and service pair. This corresponds to the POSIX getaddrinfo() function.
    # 给定 host 和 service(port/well known service name),返回所有可用的服务器地址信息。

function wrk.connect(addr)

    wrk.connect returns true if the address can be connected to, otherwise
    it returns false. The address must be one returned from wrk.lookup().
    # 测试给定的服务器地址信息是否可以成功创建连接
|
调用POST接口
wrk压力测试POST请求–以本地项目地址为例:http://192.168.180.126
登录接口:/api/user/login/
请求数据:
1
2
3
4
5
|
{
    "username":"admin",
    "password":"admin123456",
    "code":666
}
|
1.编写lua脚本,填写post的数据,如login.lua
 1
 2
 3
 4
 5
 6
 7
 8
 9
10
11
12
13
14
|
wrk.method = "POST"
wrk.body = '{"username":"admin","password":"admin123456","code":666}'
wrk.headers["Content-Type"] = "application/json"

function request()
   return wrk.format("POST",nil,nil,body)
end

function response(status, headers, body)
   if status ~= 200 then
      print(body)
      wrk.thread:stop()
   end
end
|
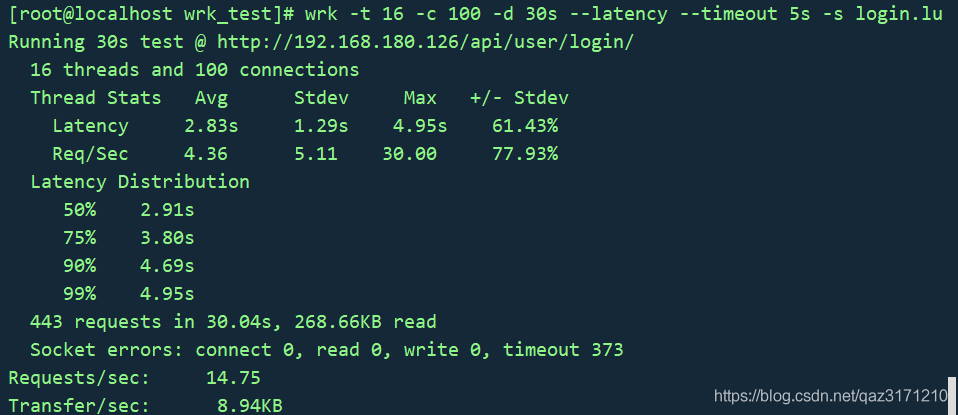
2.执行wrk,开始压力测试。
1
|
wrk -t 16 -c 100 -d 30s --latency --timeout 5s -s login.lua http://192.168.180.126/api/user/login/
|
压测结果如下:
认证后发起请求
请求的接口需要先进行认证,获取token后,才能发起请求,处理如下:
 1
 2
 3
 4
 5
 6
 7
 8
 9
10
11
12
13
14
|
token = nil
path  = "/auth"

request = function()
   return wrk.format("GET", path)
end

response = function(status, headers, body)
   if not token and status == 200 then
      token = headers["X-Token"]
      path  = "/test"
      wrk.headers["X-Token"] = token
   end
end
|
上面的脚本表示,在token为空的情况下,先请求/auth接口来认证,获取token,拿到token以后,将token放置到请求头中,再请求真正需要压测的/test接口。
发送带随机参数的get请求例子
wrk压力测试带随机参数的get请求–以本地项目地址为例: http://192.168.160.30:8080
get接口:/academy/train/course/?id=
1.构造不同的get请求,请求带随机参数,则lua脚本如下:
1
2
3
4
5
|
request = function()
        num = math.random(1,10)
        path = "/academy/train/course/?id="..num
        return wrk.format("GET",path)
end
|
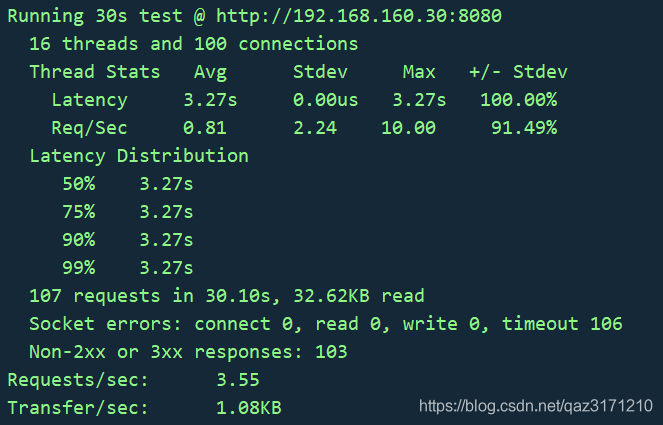
2.执行wrk,开始压力测试。
1
|
wrk -t 16 -c 100 -d 30s --latency --timeout 5s -s test.lua http://192.168.160.30:8080
|
压测结果如下:
添加参数txt文件的get请求例子
wrk压力测试添加参数txt文件的get请求–以本地项目地址为例: http://192.168.160.30:8080
get接口:/academy/train/course/?id=
id.txt文件内容如下:
1.添加参数txt文件的get请求,则lua脚本如下:
1
2
3
4
5
6
7
8
9
10
11
12
13
14
15
16
17
18
|
idmap = {}
counter = 0
function init(args)
for line in io.lines("id.txt") do
print(line)
idmap[counter] = line
counter = counter + 1
end
counter = 0
end
function request()
local path = "/academy/train/course/?id="
parms = idmap[counter%(table.getn(idmap)+1)]
path = string.format(path,parms)
counter = counter + 1
return wrk.format(nil,path)
end
|
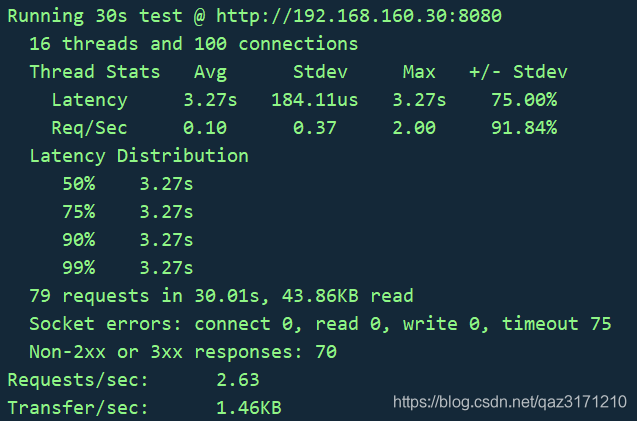
2.执行wrk,开始压力测试。
1
|
wrk -t 16 -c 100 -d 30s --latency --timeout 5s -s id.lua http://192.168.160.30:8080
|
压测结果如下:
添加参数txt文件的post请求例子
wrk压力测试添加参数txt文件的post请求–以本地项目地址为例:http://192.168.180.126
登录接口:/api/user/login/
login.txt文件内容如下:
1.添加参数txt文件的post请求,则lua脚本如下:
1
2
3
4
5
6
7
8
9
10
11
12
13
14
15
16
17
18
19
20
21
|
loginmap = {}
counter = 0
function init(args)
for line in io.lines("login.txt") do
loginmap[counter] = line
counter = counter + 1
end
counter = 0
end
function request()
local body1 = '{"username":"'
local body2 = '","password":"admin123456","code":666}'
parms = loginmap[counter%(table.getn(loginmap)+1)]
path = "/api/user/login/"
method = "POST"
wrk.headers["Content-Type"] = "application/json"
body = body1..parms..body2
counter = counter + 1
return wrk.format(method,path,wrk.headers,body)
end
|
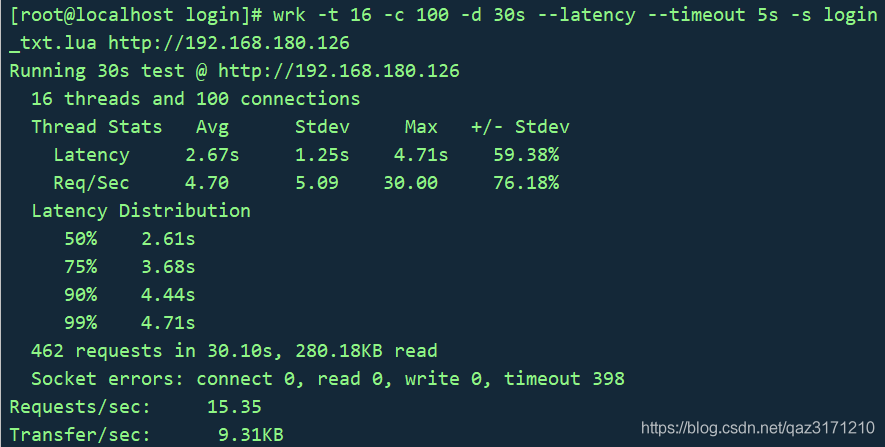
2.执行wrk,开始压力测试。
1
|
wrk -t 16 -c 100 -d 30s --latency --timeout 5s -s login_txt.lua http://192.168.180.126
|
压测结果如下:
若参数txt中有转义字符,可用如下方法处理:
1
|
parms = string.gsub(urimap[counter%(table.getn(urimap) + 1)],'\r','')
|
提交不同表单内容例子
wrk压力测试添加参数txt文件的post请求–以本地项目地址为例:http://192.168.180.126
登录接口:/api/user/login/
1.提交不同表单内容的post请求,则lua脚本如下:
1
2
3
4
5
6
7
8
9
10
11
12
13
14
15
16
17
|
wrk.method = "POST"
wrk.body = ""
wrk.headers["Content-Type"] = "application/x-www-form-urlencoded"
wrk.path = "/api/user/login/"
-- 提交不同表单内容
local queries = {
"username=admin&password=admin123456&code=666",
"username=ZY&password=666666aa&code=666"
}
local i = 0
request = function()
local body = wrk.format(method,path,headers,queries[i % #queries+1])
i = i + 1
return body
end
|
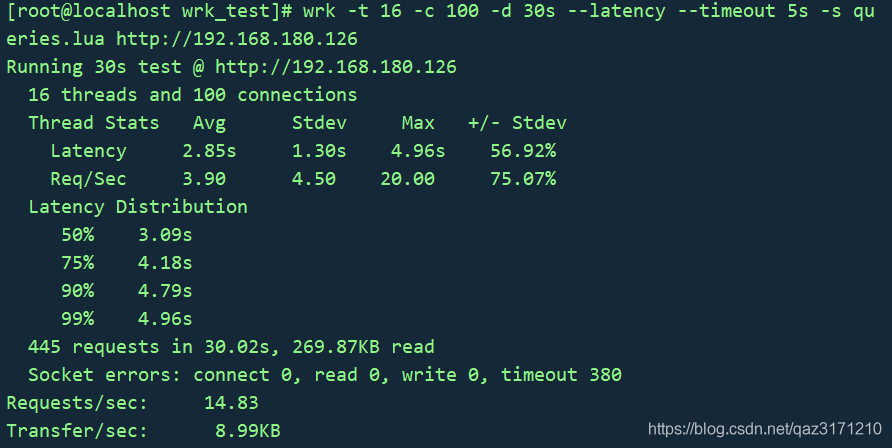
2.执行wrk,开始压力测试。
1
|
wrk -t 16 -c 100 -d 30s --latency --timeout 5s -s queries.lua <http://192.168.180.126>
|
压测结果如下:
访问多个url例子
1.需要创建一个文件名为paths.txt,里面每行是一个要测试的url网址,paths.txt如下:
1
2
|
https://www.baidu.com
https://www.csdn.net
|
2.lua脚本如下:
 1
 2
 3
 4
 5
 6
 7
 8
 9
10
11
12
13
14
15
16
17
18
19
20
21
22
23
24
25
26
27
28
29
30
31
32
33
34
35
36
37
38
39
40
41
42
43
44
45
46
47
48
49
50
51
|
counter = 0
-- Initialize the pseudo random number generator - http://lua-users.org/wiki/MathLibraryTutorial
math.randomseed(os.time())
math.random(); math.random(); math.random()
function file_exists(file)
local f = io.open(file, "rb")
if f then f:close() end
return f ~= nil
end
function shuffle(paths)
local j, k
local n = #paths
for i = 1, n do
j, k = math.random(n), math.random(n)
paths[j], paths[k] = paths[k], paths[j]
end
return paths
end
function non_empty_lines_from(file)
if not file_exists(file) then return {} end
lines = {}
for line in io.lines(file) do
if not (line == '') then
lines[#lines + 1] = line
end
end
return shuffle(lines)
end
paths = non_empty_lines_from("paths.txt")
if #paths <= 0 then
print("multiplepaths: No paths found. You have to create a file paths.txt with one path per line")
os.exit()
end
print("multiplepaths: Found " .. #paths .. " paths")
request = function()
path = paths[counter]
counter = counter + 1
if counter > #paths then
counter = 0
end
return wrk.format(nil, path)
end
|
通用压测脚本
 1
 2
 3
 4
 5
 6
 7
 8
 9
10
11
12
13
14
15
16
17
18
19
20
21
22
23
24
25
26
27
28
29
30
31
32
33
34
35
36
37
38
39
40
41
42
43
44
45
46
47
48
49
50
|
local list = {}
local delaytime = 0             -- 默认delay是0ms
local filename = "reqdata.txt"  -- 默认请求数据文件

setup = function(thread)
    for k,v in  pairs(wrk.addrs)
    do
        print(v)
    end
end

init = function(args)
    if (args[1] ~= nil) then
        delaytime = args[1]          -- 启动命令中可以指定延迟时间,如未指定,使用默认文件
    end
    if (args[2] ~= nil) then
        filename = args[2]           -- 启动命令中可以指定请求文件目录,如未指定,使用默认文件
    end
    math.randomseed(os.time())
    local i = 0
    for line in io.lines(filename)   -- 把请求包体读入后写到list里,方便后续使用
    do
        list[i] = line
        i = i+1
    end
end

request = function()
    wrk.body = list[math.random(0, #list)]    -- 随机使用一个包体
    wrk.method = "POST"
    wrk.scheme = "http"
    wrk.path = "/appstore/uploadLogSDK"
    wrk.headers["Content-Type"]="application/x-www-form-urlencoded"
    return wrk.format()
end

delay = function()
    return delaytime
end

response = function(status, headers, body)      --这里我没做特殊统计,只是在调试过程中输出了一些内容
    --print(status)
    --print(body)
    --print(wrk.format(wrk.method, wrk.path, wrk.headers, wrk.body))
    --wrk.thread:stop()
end

done = function(summary, latency, requests)
    print("99 latency:"..latency:percentile(99.0))  -- 这里我只是额外输出了99分位的延时,貌似数据不太对
end
|
参考
性能测试应该怎么做?
Usage of Benchmarking Tool WRK and WRK2
常用并发压力测试工具
wrk(1)- 详细使用
wrk - lua 进阶
轻量级性能测试工具wrk - 使用(提升篇)
轻量级性能测试工具wrk - 使用(实战篇)
Web服务压测神器wrk
wrk(2)- Lua 脚本的使用